JUMP TO TOPIC
Bounds|Definition & Meaning
Definition
A bound in mathematics is a limit on the size or value of a quantity. Bounds are often used to describe the range of possible values for a variable, or the range of possible outcomes for a function. Bounds can be used to find the maximum or minimum value of a function, or to prove that a function is continuous.
A mathematical bound is a limit that a function or variable can approach but never beyond. An example is shown below:

Figure 1: Bounds using inequalities
Applications of Bounds
The concept of a bound is crucial in many areas of mathematics, such as analysis and optimization. Analysis typically uses bounds to show the existence of certain boundaries. To find the best solution to a problem, optimization specialists employ bounds as a tool.
Types of Bounds
There are two types of bounds that are commonly used in mathematics, namely upper bounds and lower bounds. The upper bound of a function or variable is its highest value, whereas the lower bound of a variable is its minimum value. Both of these types are further explained in next paragraphs.
(a) Upper Bound
An upper Bound is a type of bound defined by a number that is greater than or equal to all the possible values of a function, variable or set. Upper bounds are widely used in mathematical optimization scenarios when the goal is to identify the largest value of a function.
Upper bounds can be formulated using a variety of methods, including derivative-based methods (e.g. gradient descent) and convex optimization. In some cases, it is possible to prove that a certain value is an upper bound. This can be done using mathematical proof techniques, such as induction.
It is often useful to have multiple upper bounds, so that the best possible solution can be found. In many cases, the best upper bound is the one that is tightest, meaning that it is closest to the actual value.
There are two types of upper bounds: (a) tight upper bounds and (b) loose upper bounds. A tight upper bound is the best possible upper bound on a quantity, while a loose upper bound is not necessarily the best possible upper bound on a quantity.
(b) Lower Bound
A lower bound is a number that is numerically lower than or equal to to all the possible values of a function, variable or set. For example, if we have a number x, then a lower bound of x would be any number that is less than or equal to x. There are many ways to formulate lower bounds. One way is to use a graph. Another way is to use inequalities.
Inequalities are mathematical statements that say that one number is greater than or equal to another number. Continuing with the same example, let‘s say we have a number x, and we want to find a lower bound for it. We can use an inequality to do this. We can start by finding an inequality that includes x. For example, we might have the inequality x ≥ 0. This inequality means that x is greater than or equal to 0.
Now, we can use this inequality to find a lower bound for x. We can do this by finding a number that is less than or equal to 0. One number that is less than or equal to 0 is –1. So, we can say that -1 is a lower bound for x.
There are two broad classes of lower bounds: (a) the tight lower bound and (b) the loose lower bound. The tight lower bound is the lower bound that is closest to the actual value of the function. The loose lower bound is the lower bound that is farthest from the actual value of the function.
Explanation of Bounds with Visual Examples
All of the above discussion has been a high level mathematical stuff but in this section we will try to explain the concept with the help of elementary level examples and diagrams.
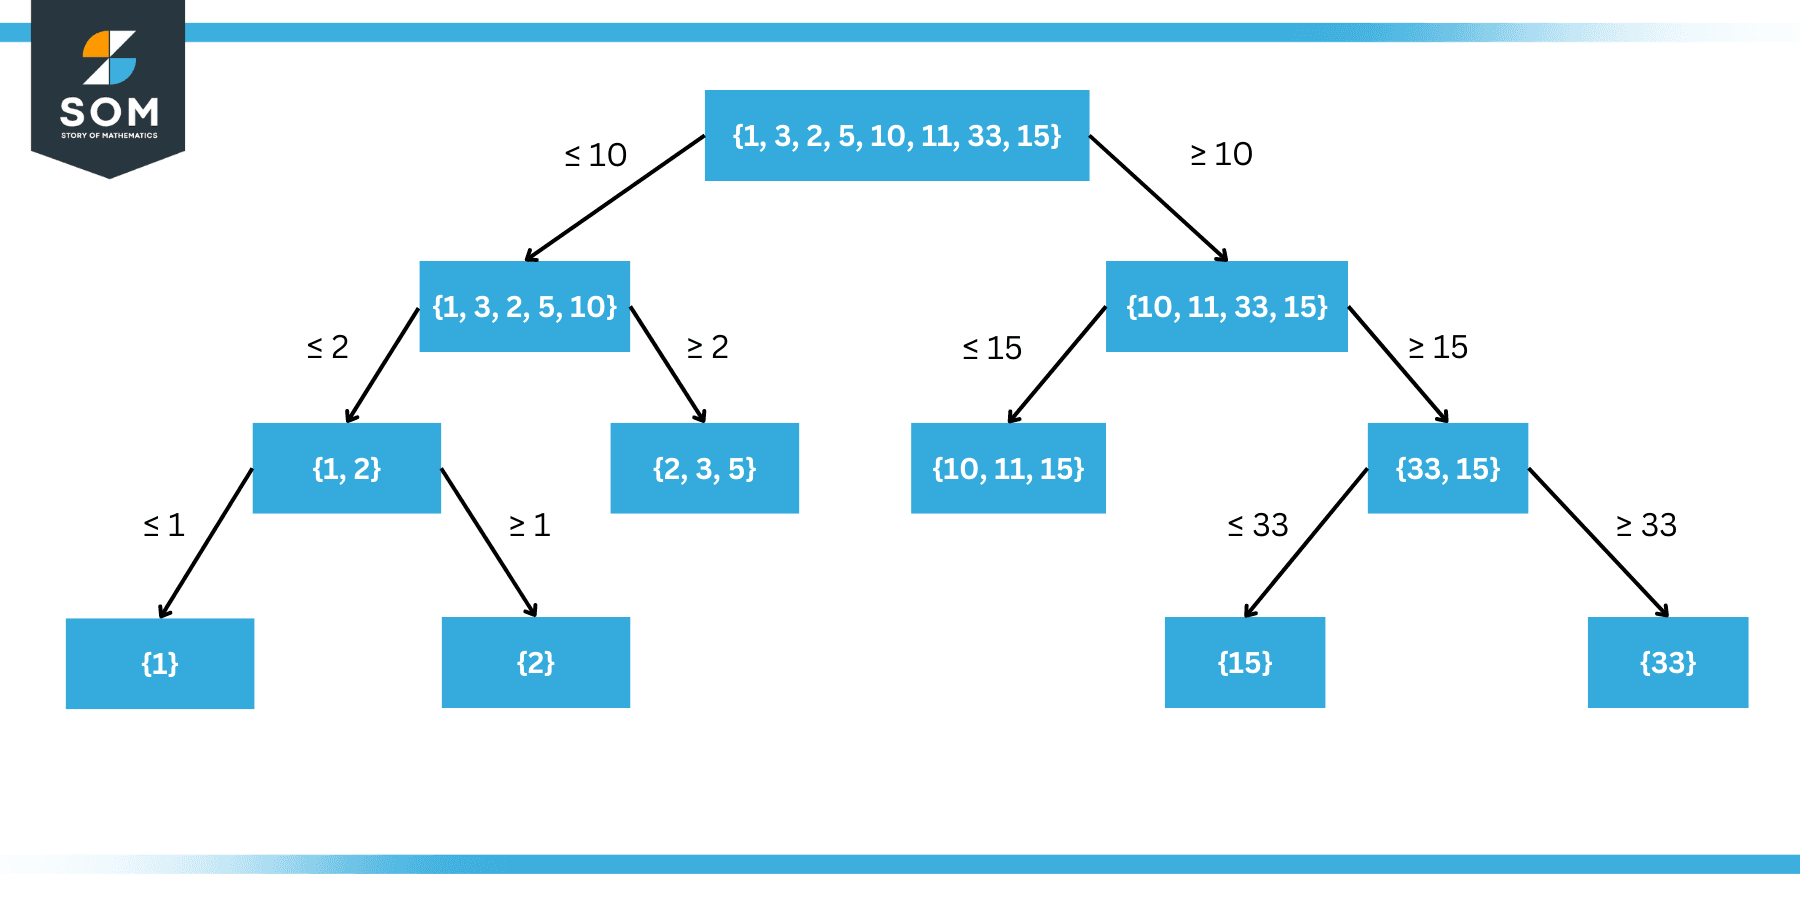
Lets consider a set A given below:
A = {1, 3, 2, 5, 10, 11, 33, 15}
Now there are several methods of finding the lower and upper bounds.
First method is to use a conditional sub-division or tree method as explained in the figure 1 above. Here we have simply assumed a middle value and successively divided the set into two equal parts until and unless only one of the elements remains in the set. It can be seen that the lowest value node represents the lower bound while the highest node represents the upper bound.
In practice, since the data is usually very large, so we normally prefer other analytical solutions of finding the minima and maxima. One of the methods is to plot the data in a histogram plot to visualize the bounds. As shown in the following figure, we can simply plot all the values in some bins, and find the highest and lowest value bin containing non-zero value:

Figure 2: Bounds using Histogram Plot
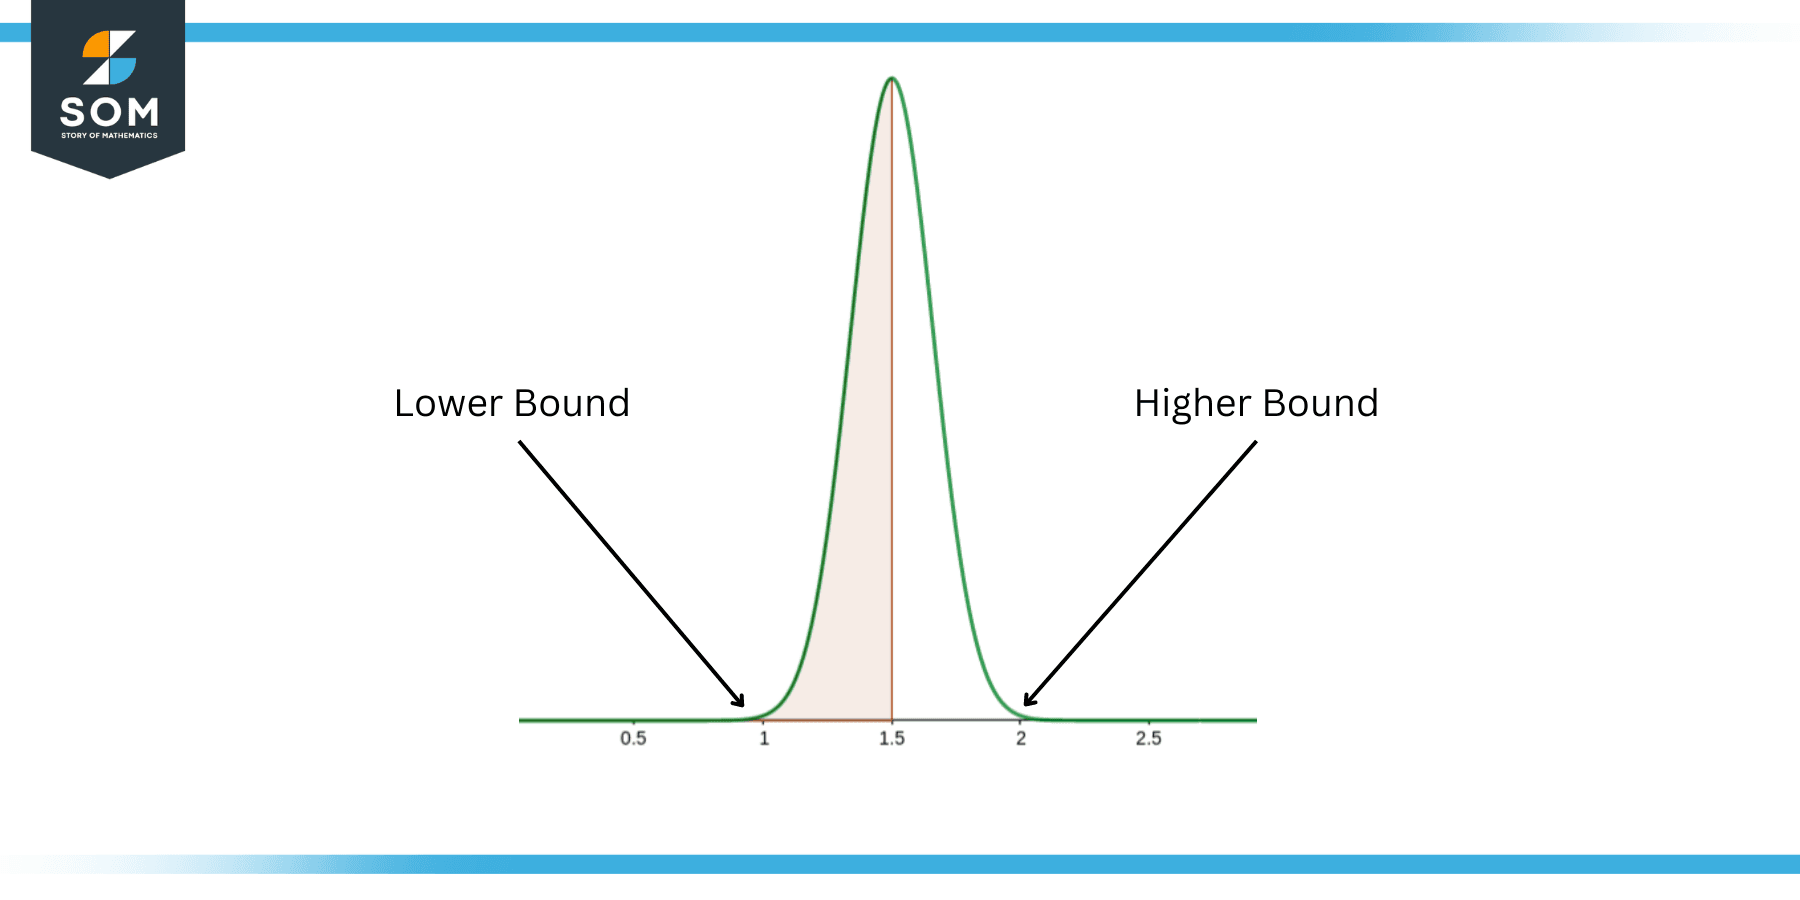
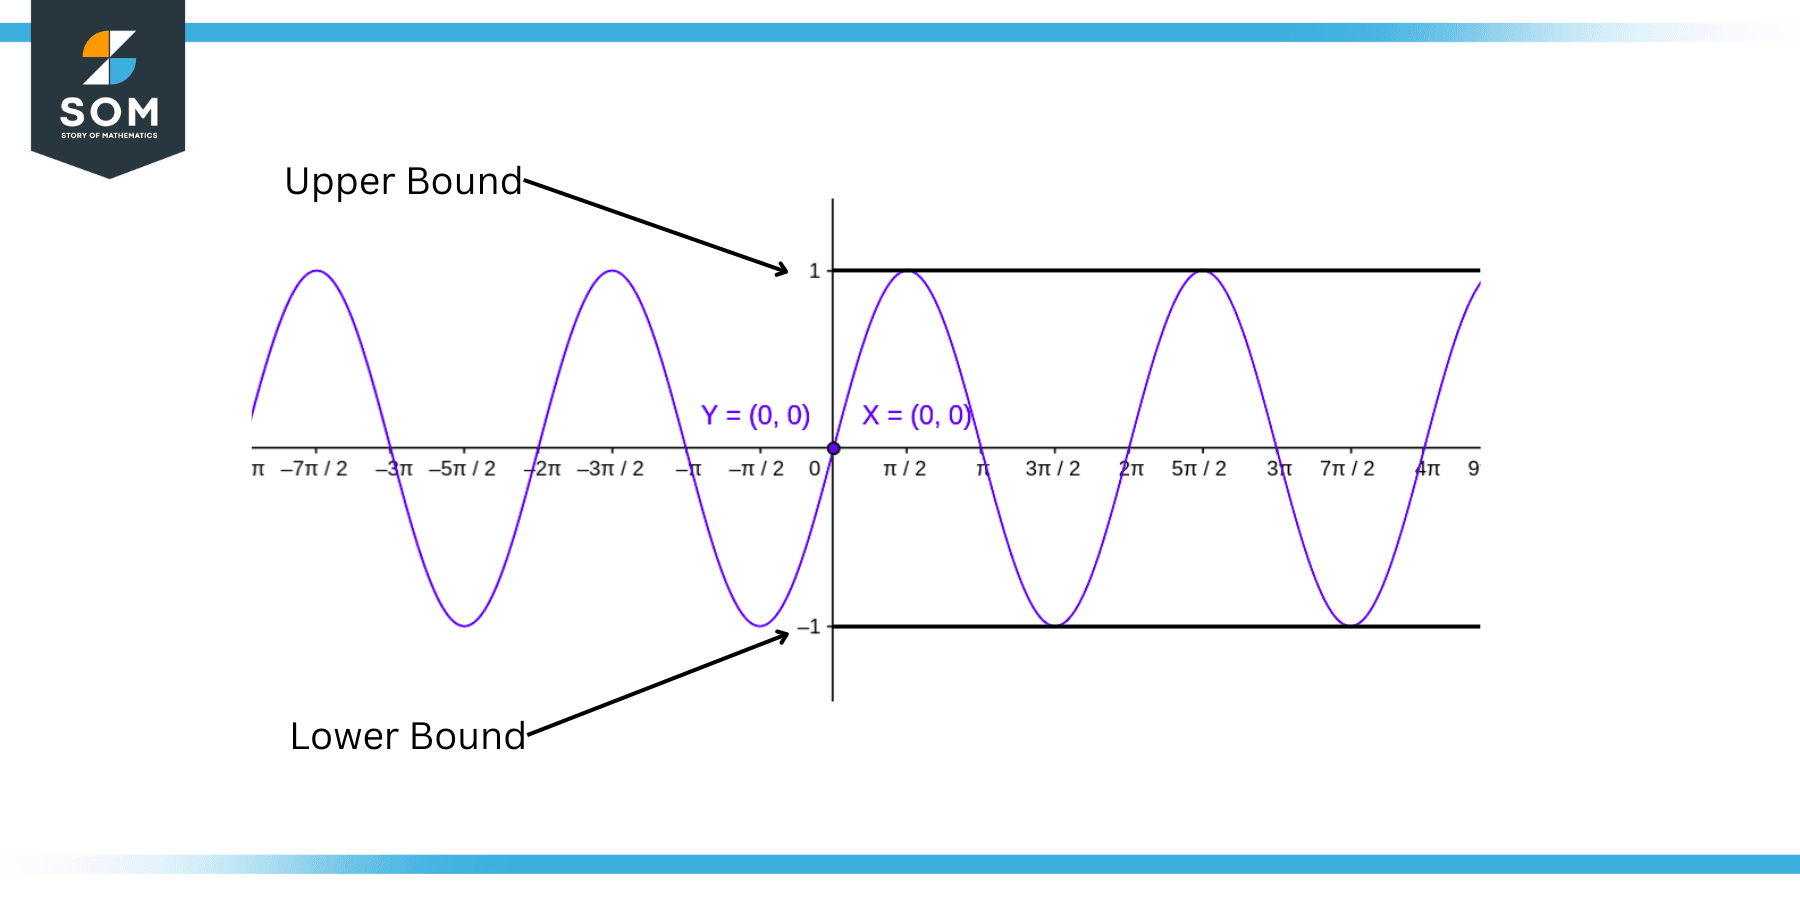
For the case of a continuous function such a depiction can also be made as shown in the figure below:

Figure 3: Bounds on a Continuous Function
Numerical Problem
Find the upper and lower bound on the following set of data points:
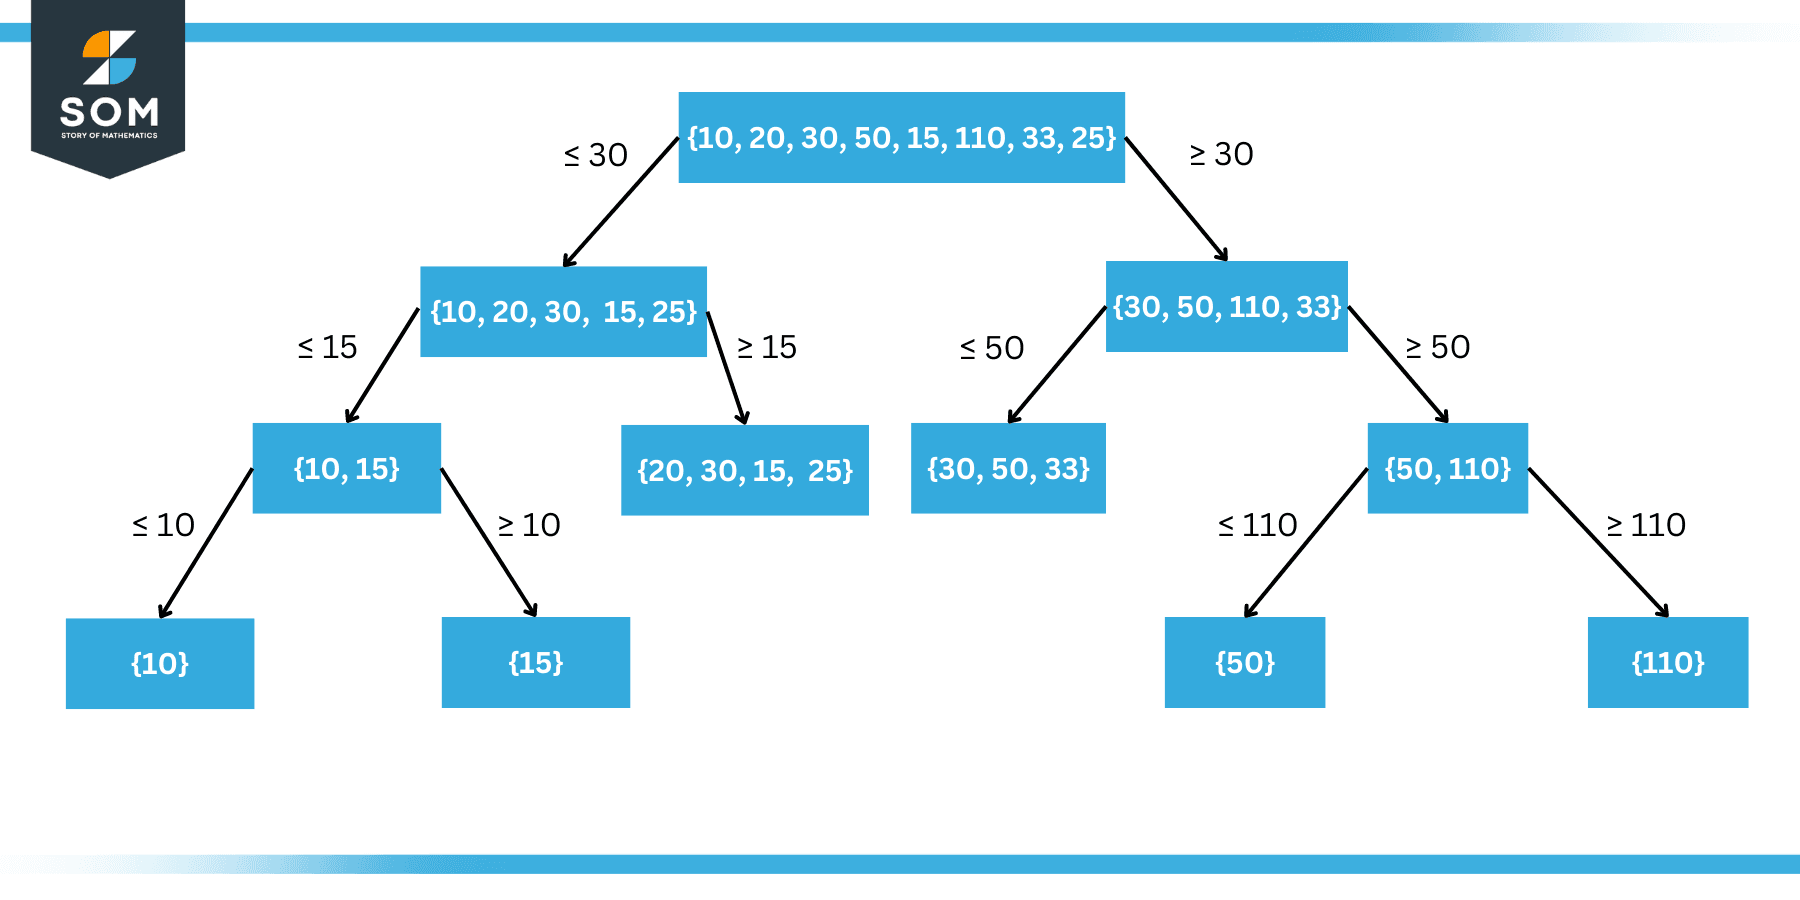
B = {10, 20, 30, 50, 15, 110, 33, 25}
Solution
Here it can be seen that if we successively divide this set into smaller parts as shown in the figure below:

Figure 4: Upper and Lower Bounds on Given Data
As shown in the figure, we first divide the data on the value 30 which leaves 5 data points. Then we split it on the value 15 which leaves 2 data points in the lower bound. Then we further split on 10 to get the final lower bound.
Similarly as shown in the figure, we first divide the data on the value 30 which leaves 4 data points. Then we split it on the value 50 which leaves 2 data points in the upper bound. Then we further split on 110 to get the final upper bound.
We can find that:
Lower Bound = 10
Upper Bound = 110
All mathematical drawings and images were created with GeoGebra.
