JUMP TO TOPIC
A form of graph called a box and whisker plot connects the boxes that indicate the distribution of numerical data with lines (also known as whiskers). Box and whisker plots show how a set of data might vary. An appropriate depiction may also be provided by a histogram analysis, but a box and whisker plot provides additional information while allowing the display of multiple data sets on the same graph. An example is shown below:

Figure 1: Example of Box and Whisker Plot
Box and whisker plots are very effective at visually summarizing data from various sources on a single graph. As such, these plots allow you to compare data from different categories easily, leading to efficient decision-making.
Some Real World Applications
When you have many data sets from different sources that are connected in some manner, consider box and whisker graphs. Here are several examples from the real world where they may prove helpful:
(a) Compiling the results of students from different institutions or for different courses.
(b) Suppose you suggest a modification in some industrial plant or process. Box and whisker plots can be used to depict the effect of this modification on production before and after this change.
(c) Different characteristics of a mechanical system
(d) Data coming from comparable devices yielding similar results
There are many other such applications that can be listed.
Statistical Information Inside a Box and Whisker Plot
The box and whisker plot shows the five summary statistics of the given numerical data.
(a) Lowest Value (Minimum)
(b) Median
(c) Highest Value (Maximum)
(d) Lower Quartile
(e) Upper Quartile
Consequently, the box and whisker plot may be constructed using the same five statistics listed above. A thorough understanding of all these parameters is a prerequisite for learning the box and whisker plots. Lets understand these characteristics one by one.
(a) Minimum value
The numerically smallest value in the given data-set or population. Its a simple minimum function.
(b) Median
If the given data is sorted in ascending order of numerical magnitude, then the median value is the number in the center of a set of values. It is usually the value in the middle in case of an odd number of samples. In the case of an even number of samples, the middle two values are averaged to find the median. Specifically, for an even number of samples, the median is the arithmetic mean of the middle two values.
(c) Highest Value (Maximum)
The numerically largest value in the given data-set or population. Its a simple maximum function.
(d) Lower Quartile
If the given data is sorted in ascending order of numerical magnitude, then the lower quartile is the numeral below which the data for the lowest 25% are included. It represents the lowest 25% outlier values of the data also called the lower tail.
(e) Upper Quartile
If the given data is sorted in ascending order of numerical magnitude, then the upper quartile is the numeral above which the data for the highest 25% are included. It represents the highest 25% outlier values of the data also called the higher tail.
Construction of Box and Whisker Plot
The construction of box and whisker plot seems simple and intuitive at first sight but it might get very confusing for the students not familiar with statistics or the ones generally not comfortable with graphs. The following set of paragraphs explain how to construct a box and whisker plot using the given data. For the sake of example, we will consider some example data given below:
Given Data = { 20, 50, 40, 30, 60, 90, 80, 70, 10 }
First step is to sort all the data points in ascending order of numerical magnitude. The resulting data sequence looks as follows:
Given Data = { 10, 20, 30, 40, 50, 60, 70, 80, 90 }
Second step is to find the Lowest Value (Minimum), Median, Highest Value (Maximum), Lower Quartile and Higher Quartile. For the given data sequence above, these values are listed below:
Lowest Value (Minimum) = 10
Median = 50
Highest Value (Maximum) = 90
Lower Quartile = 25
Upper Quartile = 75
Third step is to plot the Lowest Value (Minimum), Median, Highest Value (Maximum), Lower Quartile and Higher Quartile points on a chart in the form of vertical bars (for the case of horizontal box and whisker plot) as shown in the figure below:

Figure 2: Marking the Lowest Value (Minimum), Median, Highest Value (Maximum), Lower Quartile and Higher Quartile on chart
Fourth step is to construct box by joining the Lower Quartile and Higher Quartile Bars as shown in the figure below:

Figure 3: Constructing the Box using Lower Quartile and Higher Quartile Bars
Fifth and final step is to construct the whiskers by joining the centers of minimum and maximum value bars with the lower and higher quartile bars respectively as shown in the figure below:
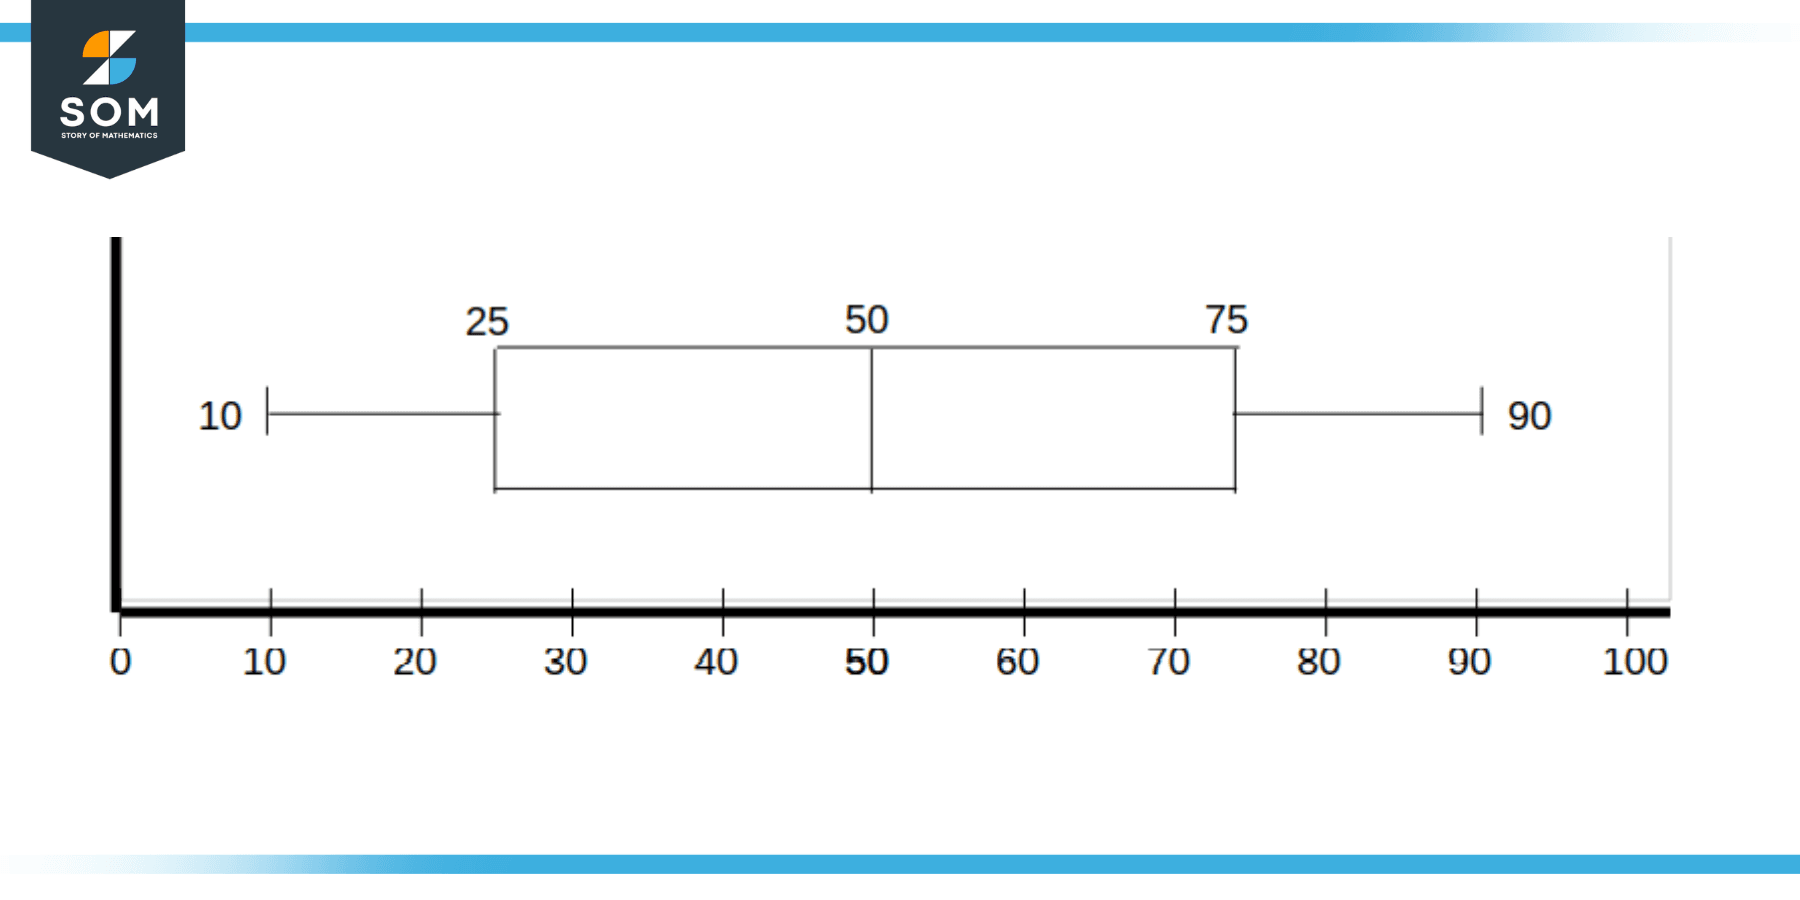
Figure 4: Constructing the Whiskers
This five step process is a comprehensive way of constructing or generating a box and whisker plot. Following is a numerical problem for further understanding.
Numerical Problems Related to Box and Whisker Plot
Construct a box and whisker plot for the following datasets containing marks of nine students in two different subjects:
Science = { 80, 50, 54, 70, 60, 82, 87, 75, 55 }
Mathematics = { 70, 80, 95, 80, 55, 80, 66, 88, 60 }
Solution
Sorting the given data sets:
Science = { 50, 54, 55, 60, 70, 75, 80, 82, 87 }
Mathematics = { 55, 60, 66, 70, 80, 80, 80, 88, 95 }
Calculating the statistical Values for Science subject data:
Lowest Value (Minimum) = 50
Median = 70
Highest Value (Maximum) = 87
Lower Quartile = 54.5
Upper Quartile = 81
Calculating the statistical Values for Mathematics subject data:
Lowest Value (Minimum) = 55
Median = 80
Highest Value (Maximum) = 95
Lower Quartile = 63
Upper Quartile = 84
Constructing the box and whisker plot for the given data points against results of students in mathematics and science subjects:

Figure 5: Box and Whisker Plot of Students’ Marks in Mathematics and Science Subjects
All mathematical drawings and images were created with GeoGebra.