JUMP TO TOPIC
- Definition
- Degree Of Accuracy
- Importance of Measuring Accuracy
- Measurement of Accuracy and Precision
- Collection of Data
- Average Value
- Percentage Error
- Absolute Deviations
- Average Deviations
- Use of Approximations in Real Life
- Degree of Approximations in the Construction Industry
- Examples of Measuring the Degree of Accuracy
Scientists and other professionals who analyze data to draw conclusions or assess hypotheses rely on precise measurements to provide reliable results. The discrepancy between a measurement’s estimated value and its actual value is referred to as accuracy.
If you deal with data, it’s critical to understand how to determine the quality of your measurements so that you can be confident your output is reliable and unbiased.
Degree Of Accuracy
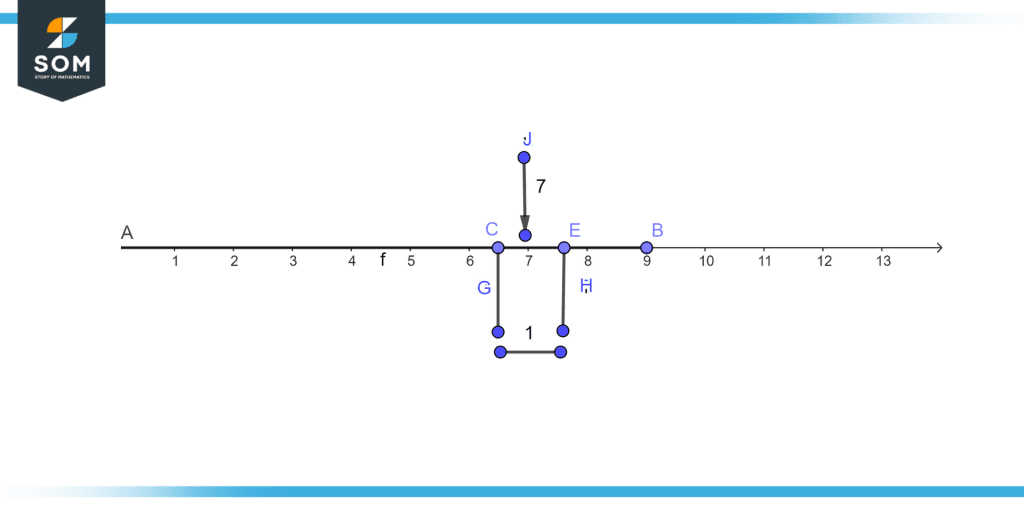
Figure 1 – Degree of accuracy
Figure 1 illustrates the degree of accuracy i.e. half a unit on both sides.
we can see in figure 1 which shows our measurement in ones so the value between 6.5 and 7.4 will be considered as seven.
Accuracy is frequently measured by calculating the average value of several measurements. To ensure precise findings while working with a collection of data, it’s also crucial to determine the precision of those measures. The degree of precision indicates how well the various measurements match one another.
Finding the average deviation, which computes the average of the measurement discrepancies, allows you to assess accuracy. Data can be accurate without being exact, but for the best outcomes, measurements should be accurate and precise.
Importance of Measuring Accuracy
Measuring calculation accuracy is crucial while working in data-driven sectors like science to ensure accurate outcomes. Professionals may ensure that they are gathering comprehensive and detailed data by using accurate measures. The information these experts generate often might assist in validating or establishing standards that others in their field might use as a guide for many years.
To guarantee the long-term validity of their findings, these experts must gather precise measurements.
Measurement of Accuracy and Precision
Following are the steps to measure the accuracy and precision of the data. Figure 2 illustrates the example of high accuracy and low precision.
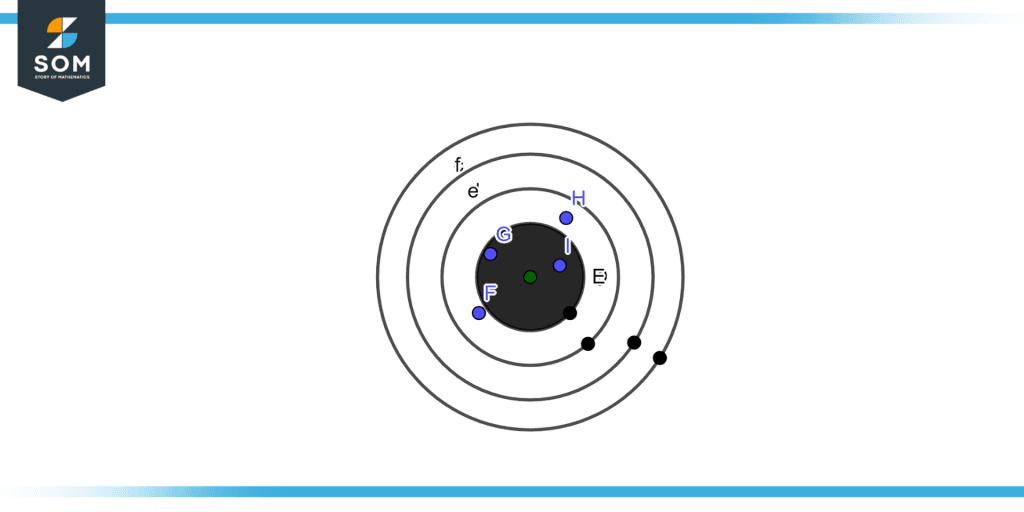
Figure 2 – High Accuracy and Low Precision
Figure 3 illustrates the example of high accuracy and high precision.
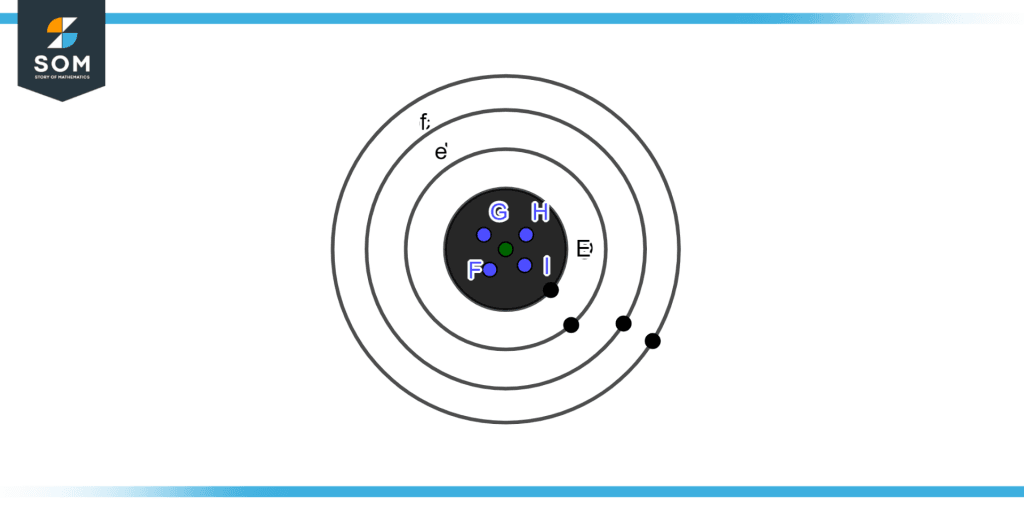
Figure 3 – High Accuracy and High Precision
Collection of Data
Start by compiling all the information you have for the experiment or project. For a thorough assessment of accuracy, it’s critical to gather as much data as you can. It’s beneficial to electronically record the measurements when working with a lot of data utilizing tools like spreadsheet software. You may identify the range of data you’ve collected by sorting the data values from least to largest.
Average Value
After gathering and organizing your data, you may calculate its average value, which can help you gauge its correctness. Add up all of your data, then divide it by the total number of measurements to get the average value. You can develop a formula in spreadsheet software that will determine this value for you. You might opt to manually calculate the measure using the following formula when dealing with tiny quantities of data:
\[ \textsf{Average Value} = \frac{\textsf{sum of data}}{\textsf{number of measurements}} \]
Percentage Error
By determining the percent error, you may also determine the accuracy of your measurements in percentages. This can be a useful tool for communicating your findings to someone who might not be familiar with the data’s standard measurement.
\[ \textsf{Percent error} = \frac{\textsf{accepted value}-\textsf{measured value}}{\textsf{accepted value}} \mathsf{\times 100} \]
Absolute Deviations
You might also want to know the precision of your data after determining the accuracy of your data since it can help you assess your measurements. Finding your data’s average value is the first step in calculating precision. You can get a collection of absolute deviations by taking each measurement out of the average value after you get it. How closely a measurement resembles the average is shown by its absolute deviation.
absolute deviation = measured value – average value
Average Deviations
You may compute the average deviation for the data, which demonstrates the precision, after computing the absolute deviation for each measurement. Add the absolute deviations for each measurement together, then divide by the total number of measurements to find the average deviation.
\[ \textsf{Average Value} = \frac{\textsf{sum of absolute deviations}}{\textsf{number of measurements}} \]
Use of Approximations in Real Life
Using rounded numbers to approximate computation results is known as an approximation. We may use approximation to determine whether or not an answer to a computation is the correct size. Round the integers to simple numbers, often 1st or 2nd, or to the closest whole number to provide an approximation of the result of a computation. Then, using these simple numbers, calculate the approximate solution.
Degree of Approximations in the Construction Industry
The unit of payment and the item’s rate are the two factors taken into account when creating an estimate. The precision with which the values are estimated should increase as the rates rise. The measurements must be exactly accurate. if payments are made in units and the rates are high.
Where masonry is paid by cubic meter, a few centimeters added or subtracted to a wall’s height or length would not make much of a difference. On the other hand, the wall’s width and thickness need to be measured quite precisely. This is because a quarter- or half-centimeters might dramatically alter the outcome.
Examples of Measuring the Degree of Accuracy
Example 1
The average value of this data is 10.02 when measuring the weight of a material and calculating distinct measurements of 10, 10, 2, 9, and 10.1 pounds. You’ve gotten a very accurate result if the real benchmark for this number is 10 pounds.
Solution
Average value = $\mathsf{\dfrac{(10 + 10.2 + 9.8 + 10.1) } {4}}$ = 10.02
Example 2
If you gather data to gauge a climate’s average temperature and discover that it is 95.3 degrees but the recognized figure is 96.8 degrees, your data’s percent error is 1.5%. This indicates that your findings were within 1.5% of the allowed value.
Solution
Percent error =$\mathsf{\dfrac{(96.8-95.3) }{96.8}}$ x 100= 1.5%
Example 3
Give the following to the nearest hundred:
a) 7.0149
b) 8.4739
c) 9.00692
Solution
a)As we have to round off to the nearest hundred and the last digit is nine if it is greater than five so it will be 7.015 now the last digit is five and the previous number is odd so it will be 7.02.
b)As we have to round off to the nearest hundred and the last digit is nine so it is greater than five so it will be 8.474 now the last digit is four less than five so it will be 8.47.
c) As we have to round off till the nearest hundred and the last digit is two so it is less than five so it will be 9.0069 now the last digit is nine and it is greater than five so the number will be 9.007 last digit is seven which is greater then five so it will be 9.01.
All images/mathematical drawings were created with GeoGebra.