JUMP TO TOPIC
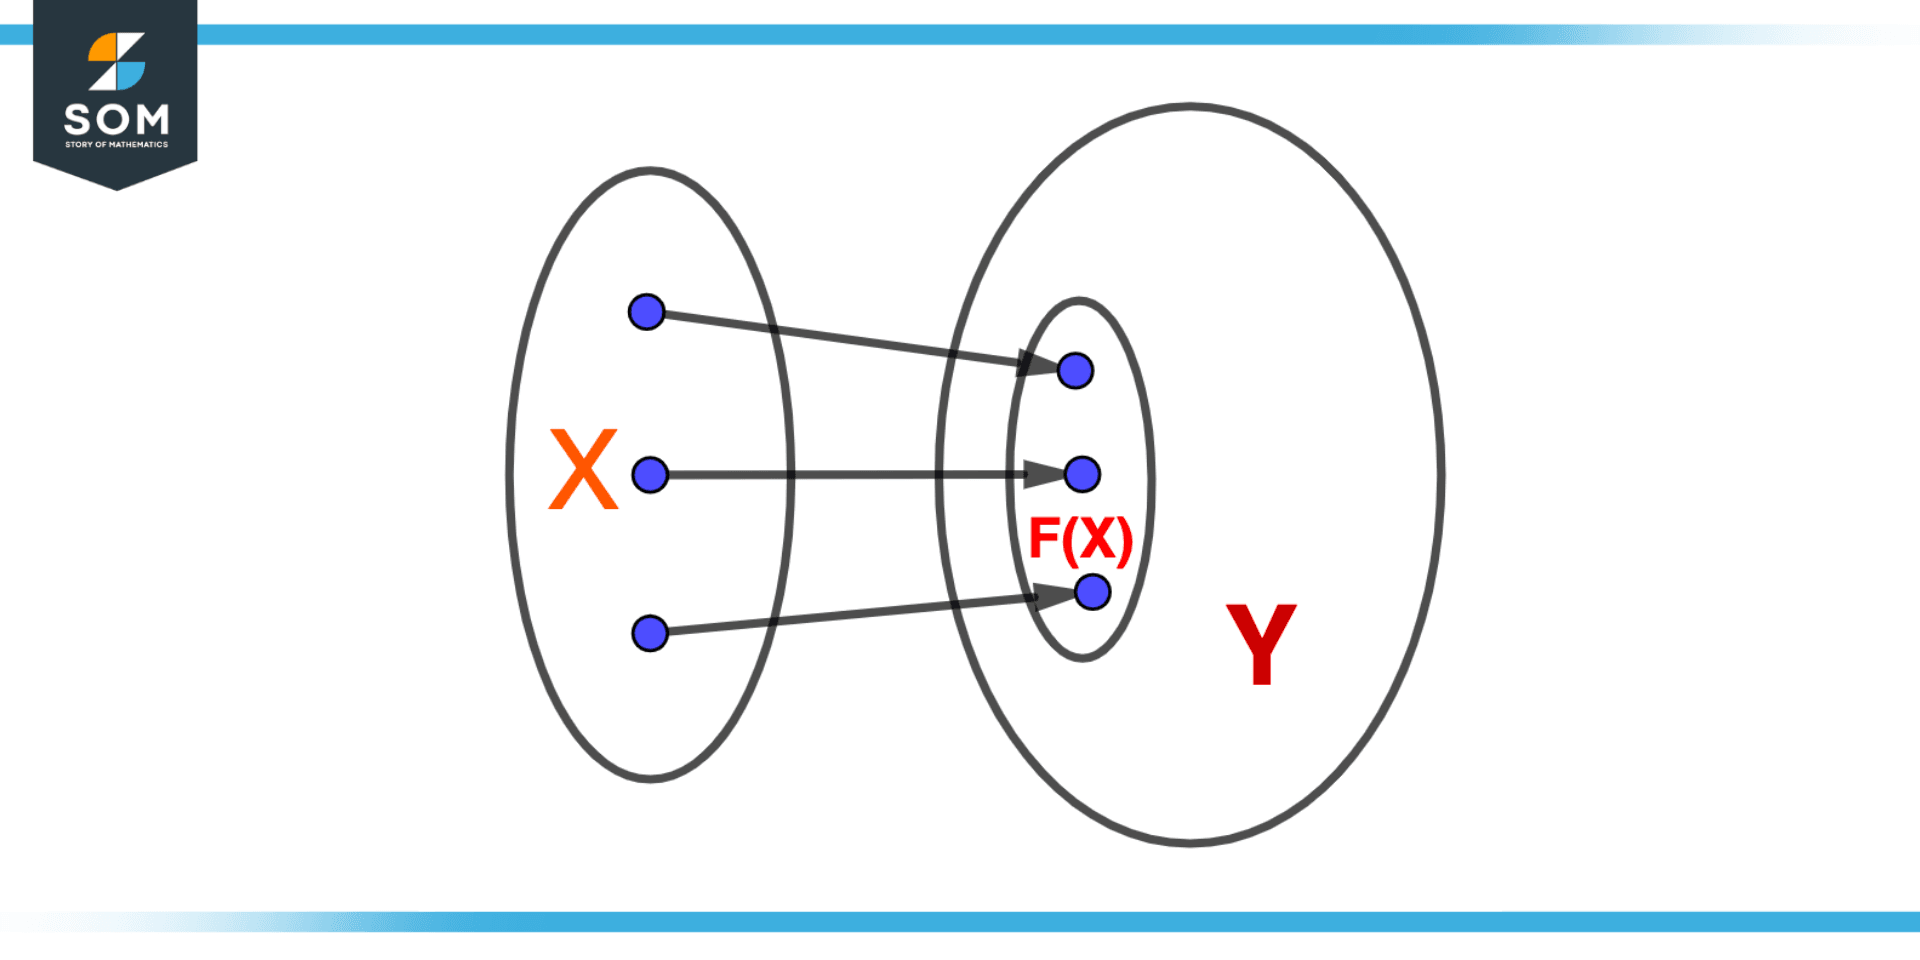
Figure 1 – Illustration of the image of a function
The range of a function, also referred to as the image of the function, is the collection of all possible outputs. A function’s image is significant because it provides a visual representation of the function’s output values, enabling us to spot patterns and make predictions. The idea of the image of a function and its uses in mathematics and practical issues will be discussed in this article.
Demonstrating the Concept of Image
In mathematics, we designate the image of a function as f(X), where X is the set of all potential inputs, and the function f is one that maps inputs x to outputs y. The image is a subset of the codomain, which is the set of all possible outputs and is referred to as the codomain of the function.
Consider the function f(x) = x2 as an illustration. Any real number may be used as an input value (x), and the output value (y) will be the square of the input value. The set of all feasible real number squares, also referred to as the set of non–negative real numbers, is the function f’s image.
Visualizing Image
Mathematicians often find it helpful to visualize the image of a function because it clarifies how the function behaves and reveals patterns in its results. The graphical representation of a function in mathematics frequently places the inputs on the x-axis and the outputs on the y-axis.
We can see how the output values change as the input values change by plotting the image of a function, and we can spot any patterns or trends in the data.
Consider the function f(x) = x2 as an illustration. When we plot the function’s image, we obtain a parabolic shape, as shown in figure below.
The image of the function, as shown by the points on the graph, is a collection of non-negative real numbers. Additionally, we can see that the function is increasing, which means that as the input values rise, so do the output values.
Properties of Image
Some properties of a function’s image are detailed below:
- A function’s codomain is subset by its image.
- Depending on how many outputs a function generates, its image can either be finite or infinite.
- Depending on how the outputs are distributed, the image of a function can either be discrete or continuous.
- A function’s image is always closed, which means it includes its boundary points.
- Depending on the kind of inputs and outputs, the image of a function can be a collection of real numbers, complex numbers, or any other kind of mathematical object.
- No matter what the inputs are, a function’s image is always determined by its outputs.
- Finding the highest and lowest outputs of a function can yield its image, as can employing algebraic strategies like locating the function’s domain and codomain.
- If the inputs are limited to a smaller set or the function is altered in some way, the image of the function may change.
- A graph or table of values can be used to depict the image of a function.
These properties are extremely helpful when we get into more complex applications of mathematics.
Finding an Image of a Function
Depending on the kind of function and the kind of output, there are various ways to determine a function’s range(image). The most typical approach is to use the function’s graph to determine the range.
Method 1
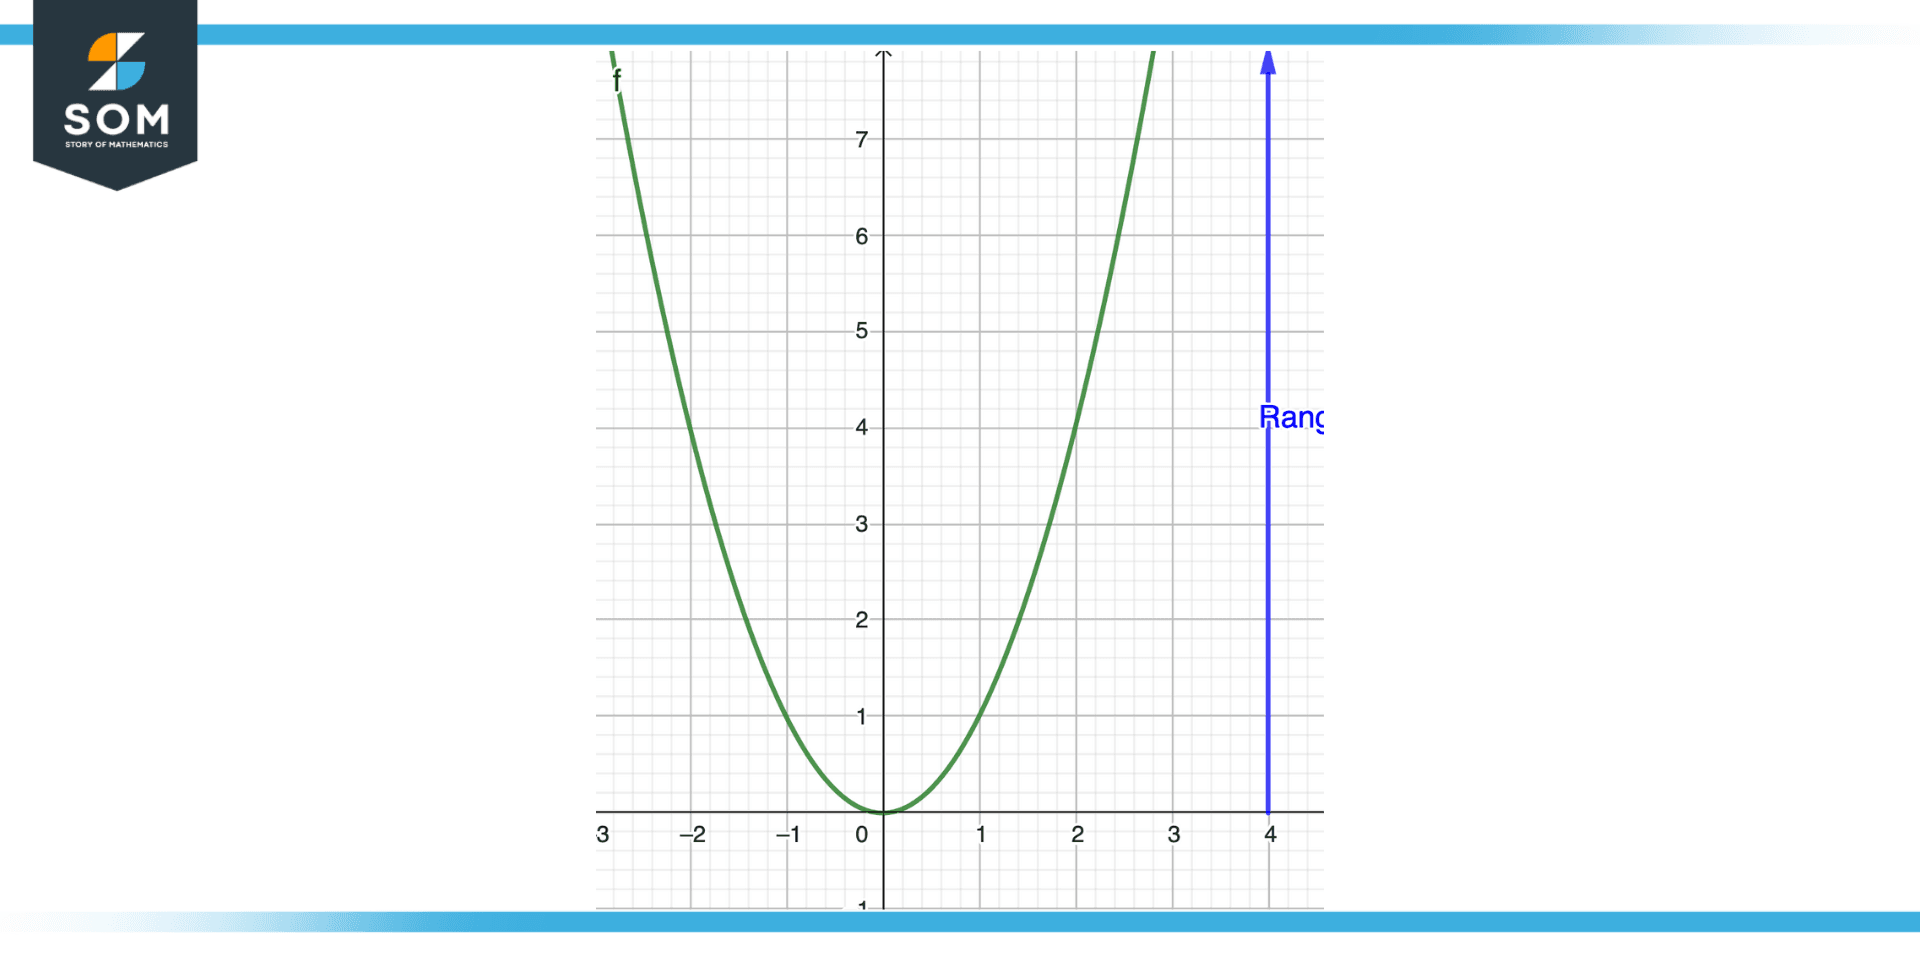
Figure 2 – Finding an image of a parabola using geometry
We must ascertain the highest and lowest output values that the function generates in order to determine the range(image) of a function using its graph. Consider the function f(x) = x2 as an illustration. Finding the vertex of the parabola will reveal the output values that are highest and lowest for this function, which has a parabolic graph.
The vertex is the point on the parabola’s graph where it reaches its highest or lowest point. It is also the location where the function’s x-coordinate equals the average of the x-coordinates of the two graph points with the same y-coordinate.
Method 2
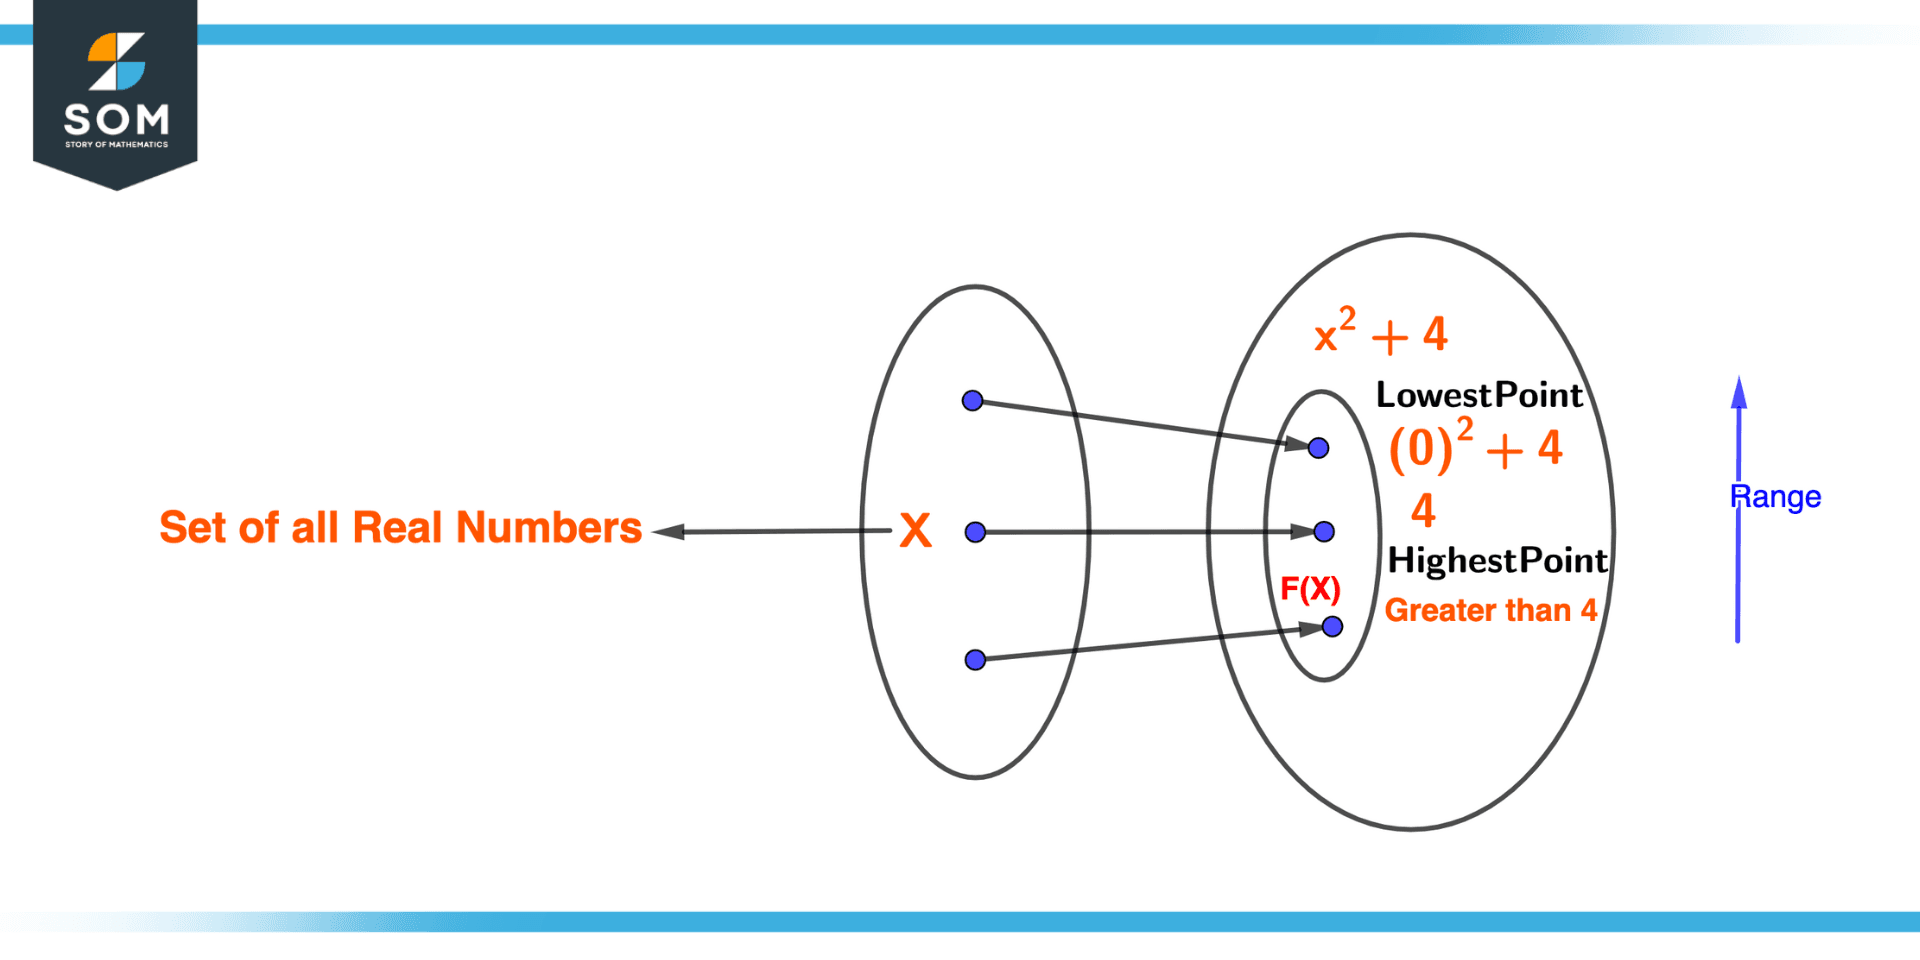
Figure 3 – Finding the image of a function using the algebraic method
Using algebraic methods, such as identifying the function’s domain and codomain before identifying the subset of the codomain that corresponds to the range(image), is another way to determine a function’s range (image).
Consider the function f(x) = x2 + 4 as an illustration. We must first identify the codomain, which is the set of all real numbers, in order to determine the function’s range(image). The subset of the codomain that corresponds to the range(image), or the set of all real numbers greater than or equal to 4, must then be located.
Application of Image of Function
In mathematics and numerous fields, the image (or range) of a function has several crucial applications, such as.
- Modeling real-world phenomena: Real-world phenomena like population growth, supply and demand, or temperature change can be modeled using an image of a function.
- Engineering and physics: Relationships between variables, such as force, velocity, and acceleration, are described using the image of a function.
- Economics: To model market trends and forecast consumer behavior, economists use images of functions.
- Control systems: To design systems that can automatically modify their behavior based on inputs, control systems use an image of a function.
- Data visualization: Images of functions can be represented graphically as graphs, which offer a clear and concise illustration of the data and the connections between it.
- Image and signal processing: To analyze and manipulate digital signals, such as audio and video signals, the image of a function is used.
There are numerous other cases where knowing the image of a function allows us to make convenient assumptions and use them to model various problems.
Example
Consider the function f(x) = x2. Find an image of value 4 by this function.
Solution
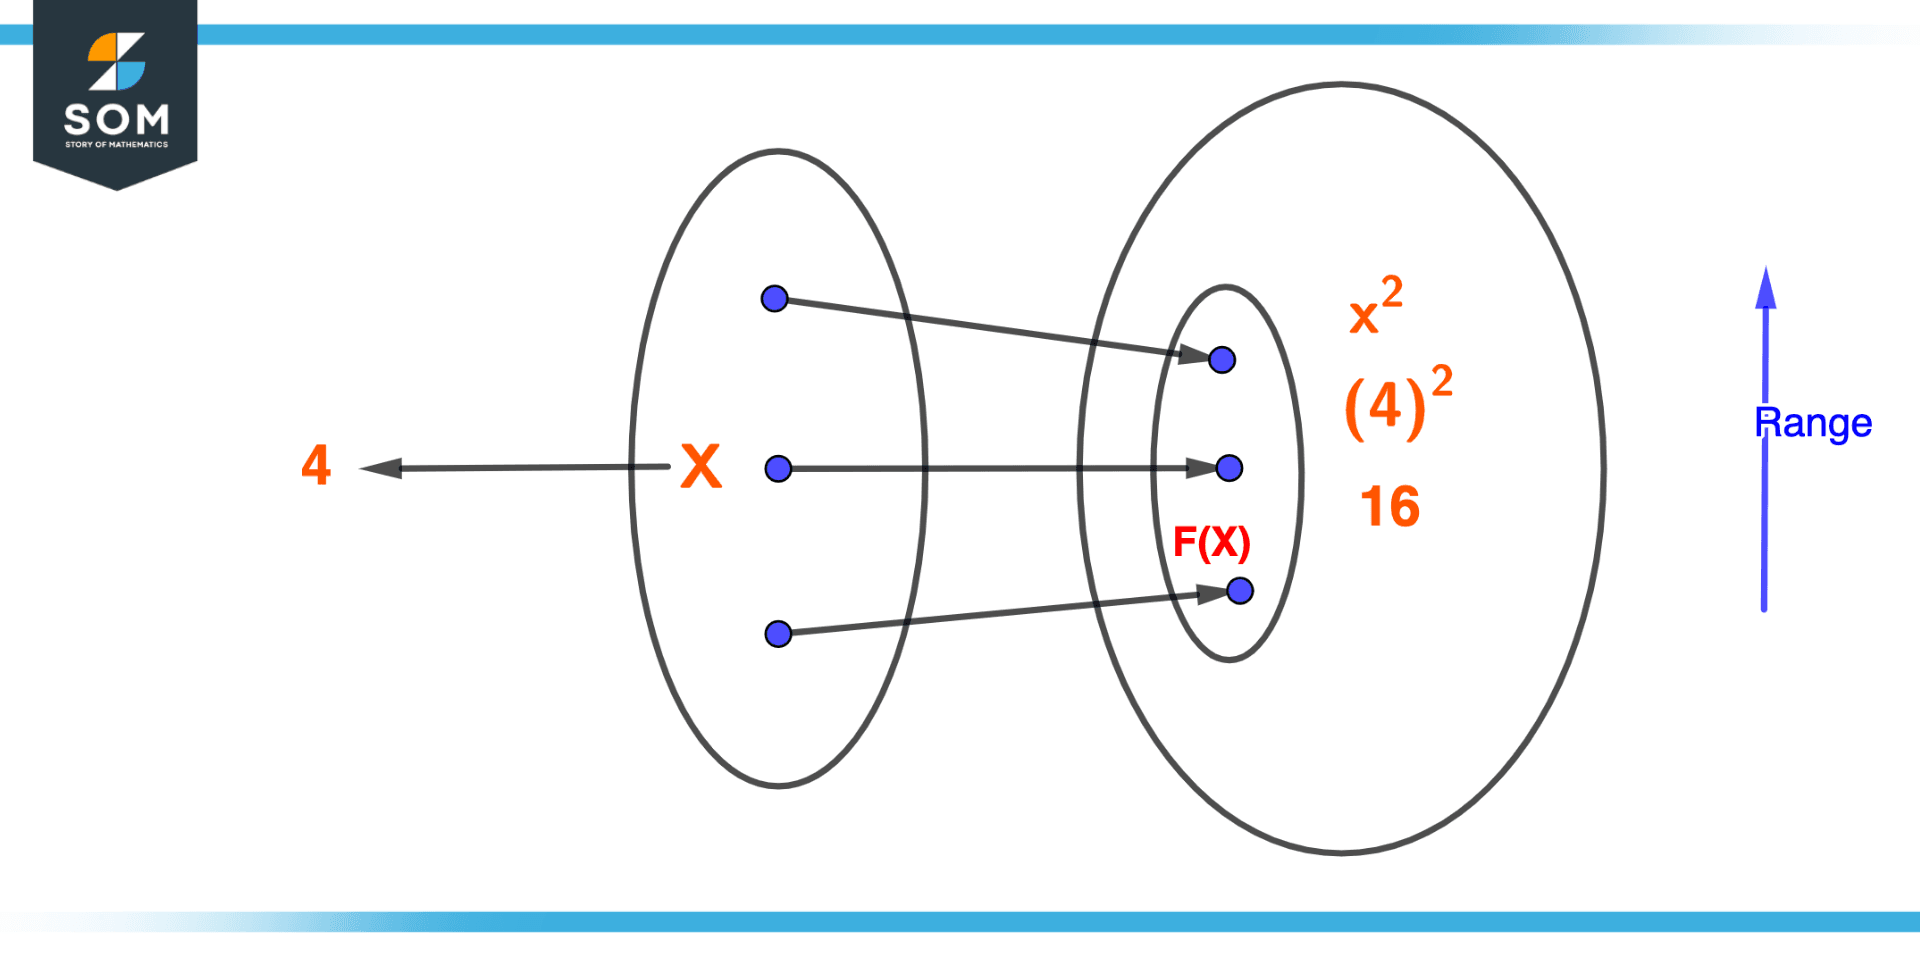
Figure 4 – Example of an image of a function
f(x) = x2
f(x) = (4)2
f(x) = 16
So the image of 4 by the function f is f(4) = 16
All mathematical drawings and images were created with GeoGebra.