JUMP TO TOPIC
Figure 1 shows the calculation of the mean of four numbers 3, 6, 9, and 12, given in a data set.
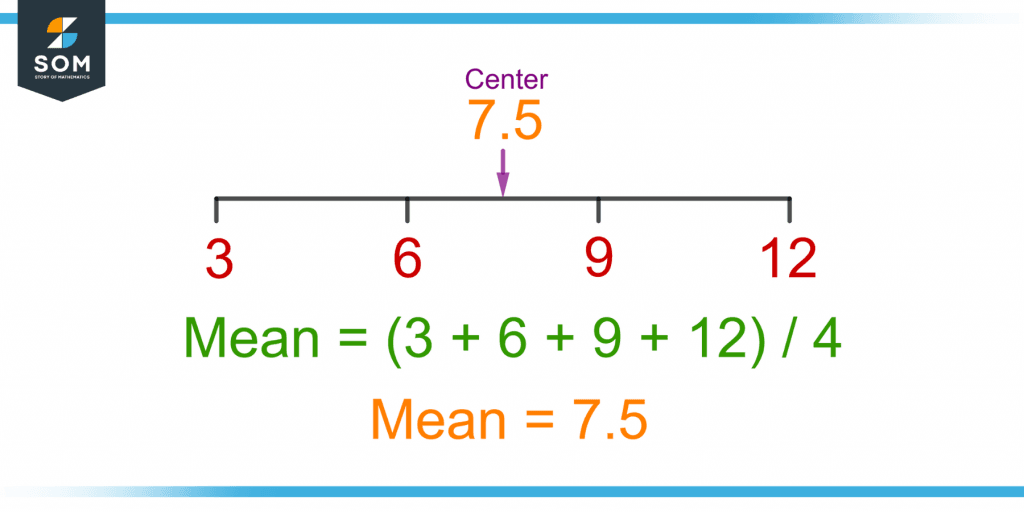
Figure 1 – Demonstration of Mean as a Measure of Central Tendency of a Given Data Set
Notice how the mean is located at the center of the data set.
Mean’s General Formula
The mean is the sum of all the values in the given data divided by the total number of values, so its formula can be written as:
Mean or Average = Sum of Values / Total Number of Values
Other Measures of Central Tendency
The other measures of central tendency are the mode and the median. Each measure of central tendency indicates a different central value of a given set of numbers.
Median
The middle value of a data set is known as the median when the numbers in the data set are arranged in ascending order.
Mode
The value most repeated in a given set of numbers is known as its mode.
Figure 2 shows the calculation of the mean, mode, and median from a given set of numbers.
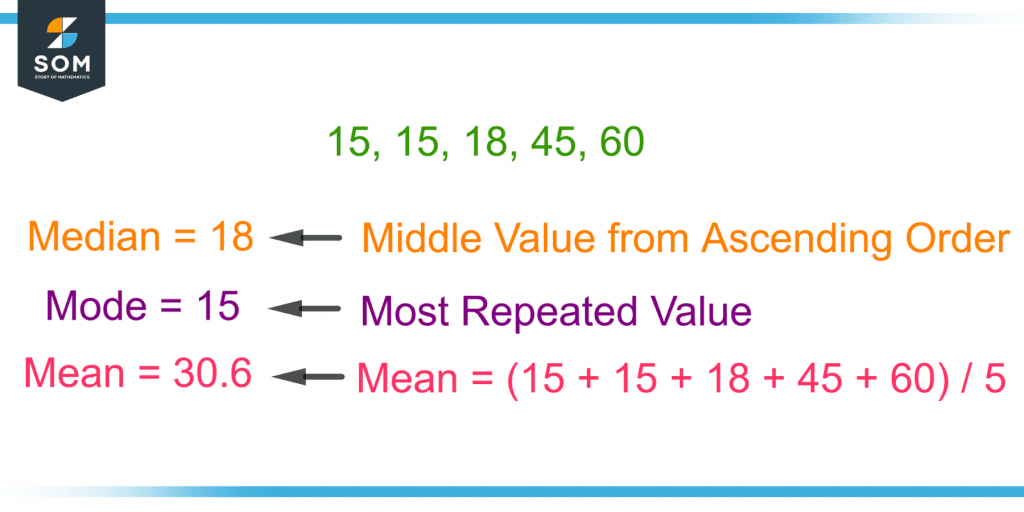
Figure 2 – Calculation of Mean, Mode and Median for a Given Set of Values
Relationship Between Mean, Mode, and Median
The relationship between mean, mode, and median, also known as the “empirical formula,” exists only for a skewed distribution. It is given as:
2 * Mean = 3 * Median – Mode
If the mode and median for a given skewed distribution, the mean can be calculated from the above formula by dividing it by 2 as:
Mean = (3 * Median – Mode) / 2
Calculation of Mean for Different Types of Data
In statistics, there are two types of data: grouped data and ungrouped data. For both types of data, the formulas for calculating the mean are different.
Grouped Data
To calculate the mean $\overline{Y}$ for grouped data, the following formula is used:
\[ \overline{Y}_{\text{grouped data}} = \frac{\sum f_i y_i}{ \sum f_i } \]
Where f is the frequency of the values in the frequency distribution grouped data.
The numerator is calculated by first multiplying the values $y_1,\, y_2,\, \ldots,\, y_i$ with their respective frequencies $f_1,\, f_2,\,\ldots,\, f_i$. The products $f_{1}y_{1},\, f_{2}y_{2},\, \ldots,\, f_{i}y_{i}$ are added to give the numerator.
The denominator is obtained by adding the frequencies. Figure 3 shows the mean calculation for grouped data.
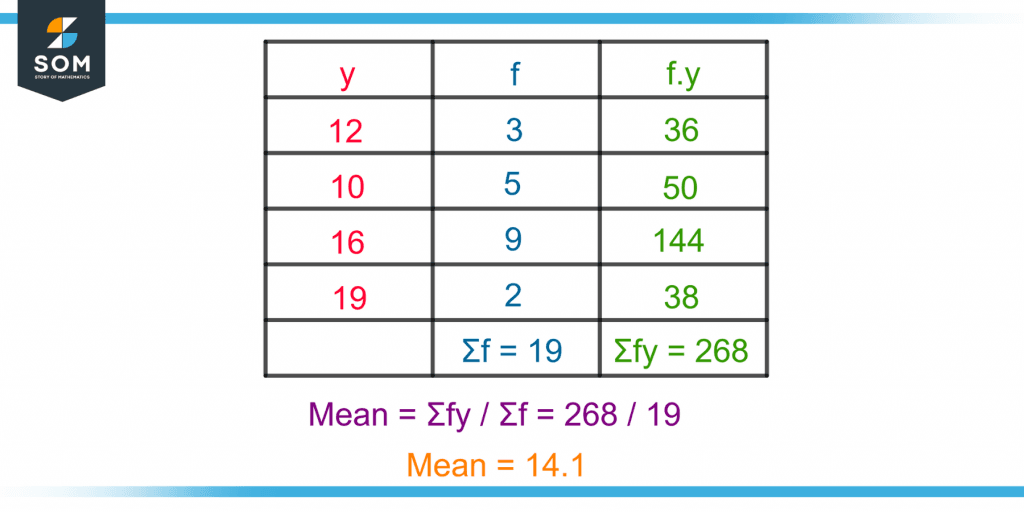
Figure 3 – Mean Calculation for a Grouped Data (Frequency Distribution)
Ungrouped Data
For ungrouped data, only the values $y_1,\, y_2,\, \ldots,\, y_m$ are given. The mathematical formula for mean $\overline{Y}$ for ungrouped data is:
\[ \overline{Y}_{\text{ungrouped data}} = \frac{ y_1 + y_2 + \cdots + y_m}{m} \]
Where “m” is the number of values. If some of the values in the ungrouped data are negative, the same formula is used to calculate the mean.
Major Types of Mean
There are three main types of mean, arithmetic mean, geometric mean, and harmonic mean.
Arithmetic Mean
The arithmetic is the sum of all the observations divided by the total number of observations. The A.M is given by the formula:
\[ A.M = \frac{ \sum y_m}{m} \]
For example, the arithmetic mean of 2, 7, 1, and 5 is:
A.M = (2 + 7 + 1 + 5) / 4 = 3.75
Till now we have discussed the arithmetic mean, as by “mean” the arithmetic mean is usually considered.
Geometric Mean
The geometric mean G.M of two numbers p and q is the product of p and q to the square root of its product. Mathematically, it is:
G.M = $\sqrt{p \times q}$
For example, the geometric mean of 6 and 9 is:
G.M = $\sqrt{6 \times 9}$ = $\sqrt{54}$ = 7.348
The geometric mean of “m” values $y_1,\, y_2,\, \ldots,\, y_m$ is the product of these values to the mth root or 1/m power. So, in general, the G.M is:
\[ G.M = \sqrt[m]{ y_{1} \times y_{2} \times \cdots \times y_{m} } \]
Harmonic Mean
The harmonic mean H.M of two numbers p and q is given by:
H.M = (2pq) / (p + q)
For example, the harmonic mean of 4 and 6 is:
H.M = 2(4)(6) / (4 + 6) = 48 / 10 = 4.8
For m values $y_1,\, y_2,\, \ldots,\, y_m$, the harmonic mean is:
\[ \text{H.M} = m \div \left[ \dfrac{1}{y_1} + \dfrac{1}{y_2} + \cdots + \dfrac{1}{y_m} \right] \]
Figure 4 shows the three measures of central tendency with the further categorization of mean and their formulas for two numbers p and q.
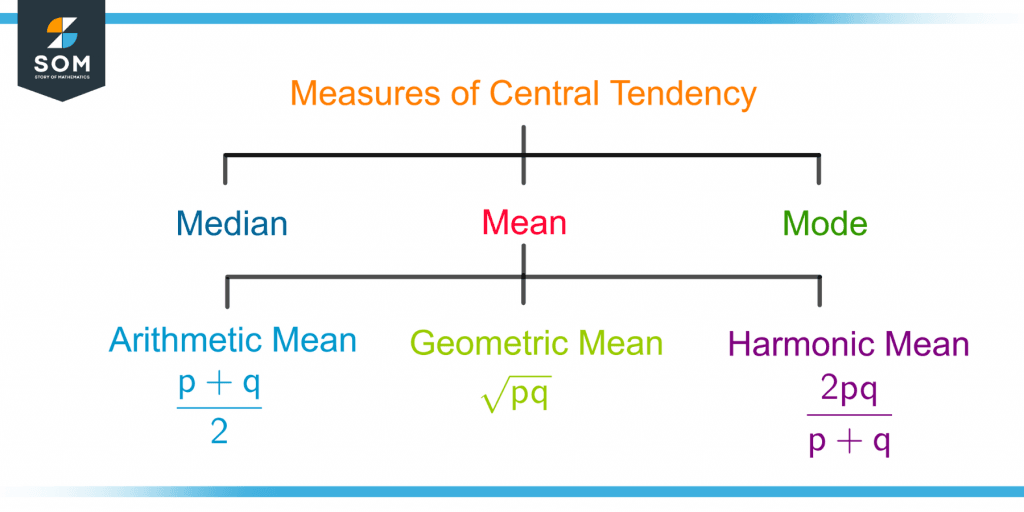
Figure 4 – Classification of the Measures of Central Tendency and Types of Mean with their Formulas
Relationship Between Arithmetic, Geometric and Harmonic Mean
For a given set of data, the relation between A.M, G.M, and H.M is:
A.M ≥ G.M ≥ H.M
The three means will be equal if all the values of the data set are the same.
Other Types of Mean
Some less common types of the mean are given as follows:
Contraharmonic Mean
For two numbers p and q, the contraharmonic mean C.M will be:
\[ \text{C.M} = \dfrac{p^2 + q^2}{p + q}\]
For m numbers $y_1,\, y_2,\,\ldots,\,y_m$, the C.M is:
\[ C.M = \frac{ {y_1}^2 + {y_2}^2 + \cdots + {y_m}^2}{ y_1 + y_2 + \cdots + y_m } \]
Root Mean Square
The root mean square $Y_{rms}$ is used to make the negative values positive in a data set. Its formula is given as:
\[ Y_{rms} = \sqrt{ \frac{ {y_1}^2 + {y_2}^2 + \cdots + {y_m}^2 }{m} } \]
Where $y_1,\, y_2,\, \ldots,\, y_m$ are the m number of values of a data set.
A Function’s Mean
The mean $x_{avg}$ of the function g(x) is the area under the function’s curve from c to d divided by the total length the area is covering. Mathematically, it is written as:
\[ x_{avg} = \frac{1}{d-c} \int_{c}^{d} g(x) dx \]
Example
Calculate the A.M, G.M, and H.M of the given set of values:
6, 8, 3, 10, 12
Show that:
A.M ≥ G.M ≥ H.M
Solution
The arithmetic mean is calculated as follows:
\[ A.M = \frac{ \sum y_m }{m} \]
A.M = (6 + 8 + 3 + 10 + 12) / 5 = 39 / 5
A.M = 7.8
The geometric mean will be:
\[ G.M = \sqrt[5]{ y_{1} \times y_{2} \times y_{3} \times y_{4} \times y_{5} } \]
G.M = ${ \sqrt[5]{6 \times 8 \times 3 \times 10 \times 12} }$
G.M = 7.03
The harmonic mean will be:
\[ \text{H.M} = m \div \left[ \dfrac{1}{y_1} + \dfrac{1}{y_2} + \dfrac{1}{y_3} + \dfrac{1}{y_4} + \dfrac{1}{y_5} \right] \]
H.M = 5 ÷ [(1 / 6) + (1 / 8) + (1 / 3) + (1 / 10) + (1 / 12)]
H.M = 6.18
As:
7.8 ≥ 7.03 ≥ 6.18
Hence:
A.M ≥ G.M ≥ H.M
All the images are created using GeoGebra.