JUMP TO TOPIC
The terms linear or non-linear are very commonly used in mathematics. Anything that follows a straight-line trend is called linear, while any equation, expression, or process that can’t be modeled with the help of a straight-line equation is called a non-linear equation.
The following figure shows some examples of some well-known non-linear equations:
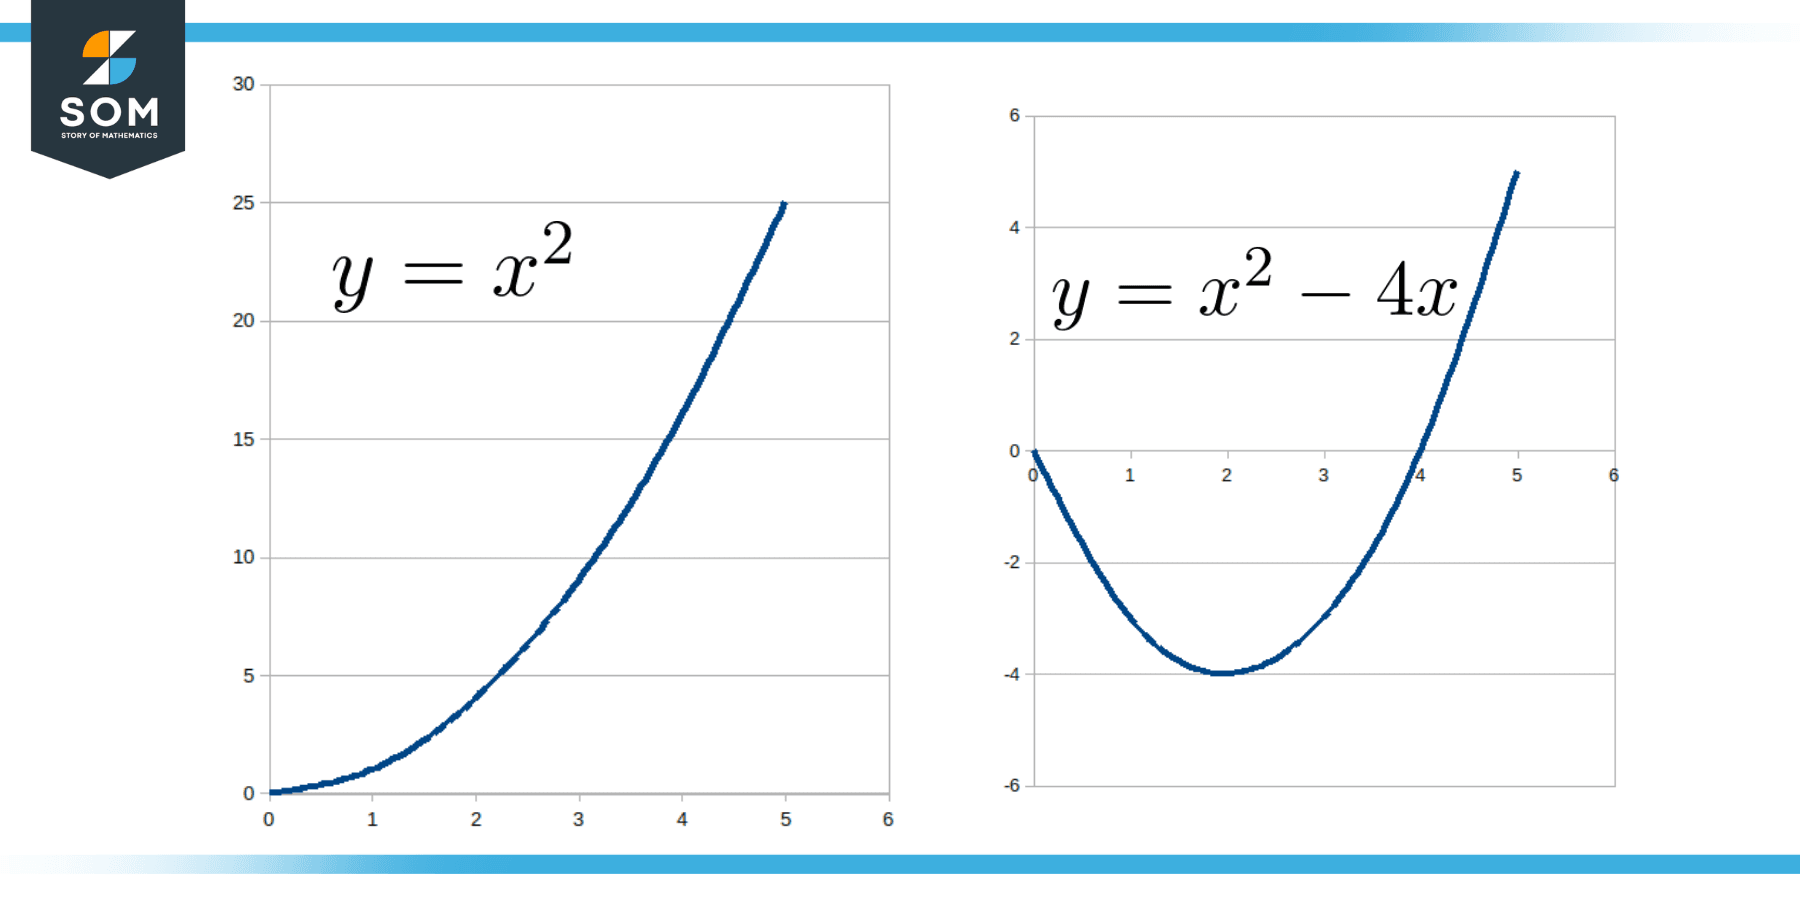
Figure 1: Examples of Non-linear Equation
Here, in the figure above, on the left is a simple parabola centered at the origin (vertex at the origin) that is represented by the equation y = x2. The right plot shows a compound polynomial of degree two defined by the equation y = x2 – 4x.
Explanation of Non-linear Equation
A mathematical equation is defined as a claim or hypothesis that the values of two expressions are equal or related. Mathematical equations comprise constants and variables as the use may dictate. Values that never change are constants. Unknown numeric values that can be changed are represented by variables like y and x.
Equations are commonly used by mathematicians in algebraic operations to discover solutions, produce graphs, and identify patterns. While working to solve mathematical problems, we come across various equations.
Some equations just utilize variables, while others only use numbers, while still others incorporate both. These numbers and variables are commonly used in linear and nonlinear equations.
Something linear is related to a line. A line is built using all of the linear equations. If any equation or process, however, can’t be represented by the equation of a straight line, then it’s termed a non-linear equation.
A non-linear equation may be thought of as a straight line whose slope and intercept may also be straight lines on their own. In simpler words, a non-linear equation changes the slope along its values. This phenomenon is illustrated in the figure below.
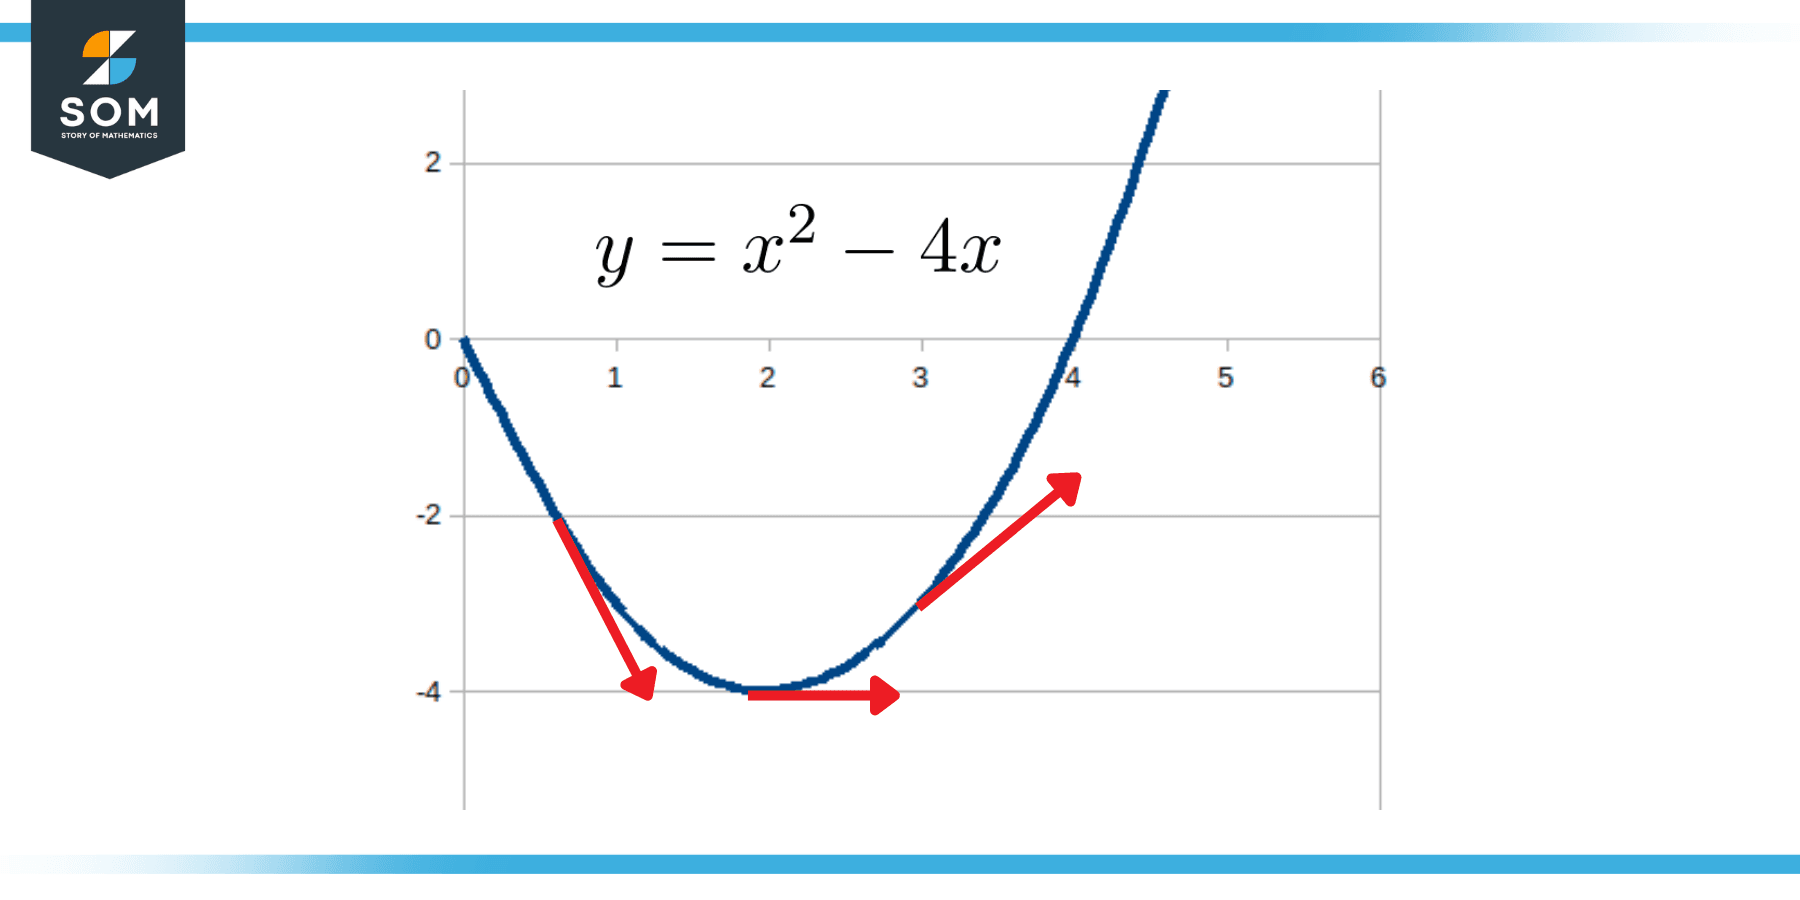
Figure 2: Change in Slope of a Non-linear Equation
In the above figure, the red arrow roughly depicts the direction and magnitude of the slope of curve y = x2 – 4x at different points.
You must be familiar with numerous sorts of mathematical equations. Let’s formally go over the distinctions between linear and non-linear equations. Definitions and examples can be used to describe the differences between them.
(a) Instead of a straight line (like the case of linear equations), a non-linear equation creates a curve whose slope continuously changes.
(b) The non-linear equations represented in the form of polynomials will always have a degree of two or greater but never equal to one since only a straight line has a polynomial degree of one.
(c) As hinted in (a), a non-linear equation assumes the form of a curve, and when the degree of the polynomial rises, the slope of the graph’s curve also rises.
(d) The equation ax2 + by2 = c is frequently used to represent and model non-linear equations, where a, b, and c are constants, and x and y are variables.
Some Common Examples of Non-linear Equations
Similar to linear equations, non-linear equations are often used by expert engineers/economists to plan projects and make forecasts. A few illustrations or example applications of non-linear equations are described in the paragraphs as follows:
Non-linear Regression Analysis or Curve Fitting
Data scientists and machine learning engineers employ regression analysis as a statistical tool to examine the relationship or correlation between significant variables of interest. Problems that are linear or non-linear can both benefit from such regression analysis. It might be applied to perform estimation and projection.
An illustration of a nonlinear equation that might be applied in regression analysis is given below:
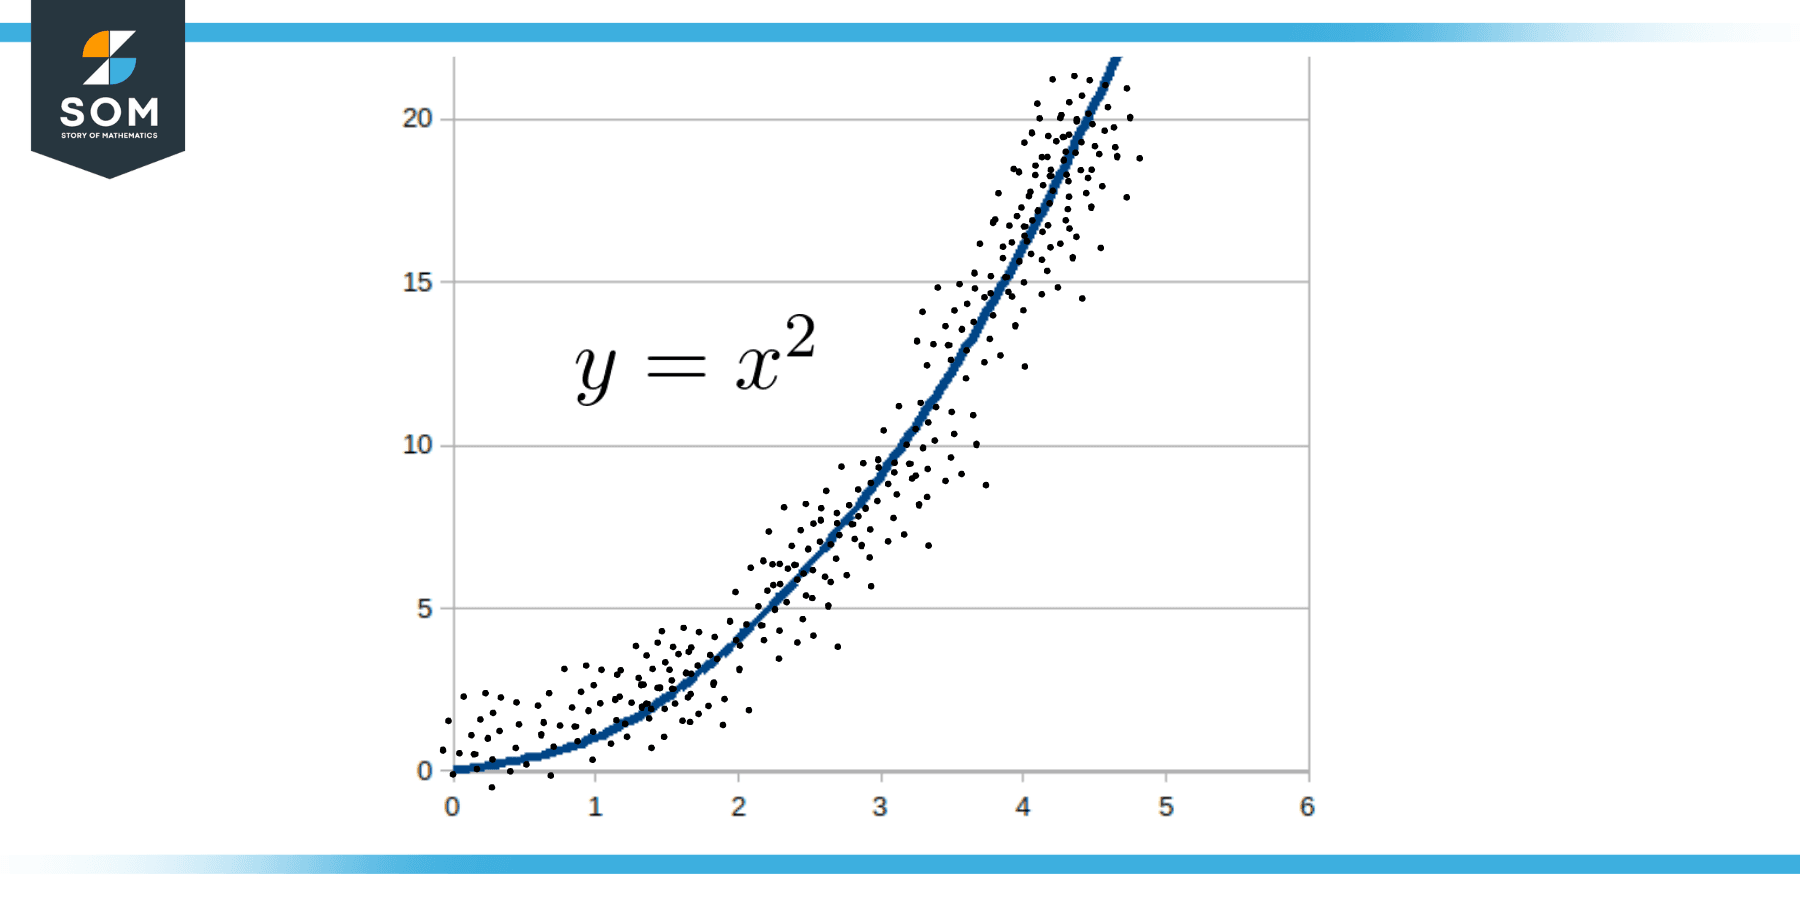
Figure 3: Non-Linear Equation in Regression Analysis
As shown in the figure, the given data points have been modeled by a non-linear equation y = x2, which is simply a parabola.
Non-linear Logarithmic Scales
A non-linear equation with a logarithmic scale displays exponential development on a graph. In a number of disciplines, including actuarial science, health, archaeology, mathematics, forensic science, finance, and geology, experts employ logarithmic scales.
Such scales are used to display multiplicative factors or perfect changes on a graph without distorting the data. Examples of logarithmic scales include the pH scale, the Richter scale, and the decibel systems.
A nonlinear equation for a logarithmic scale is usually of the form z = log10(u). The following figure shows the effect of logarithmic scales on the visualization of exponential data.
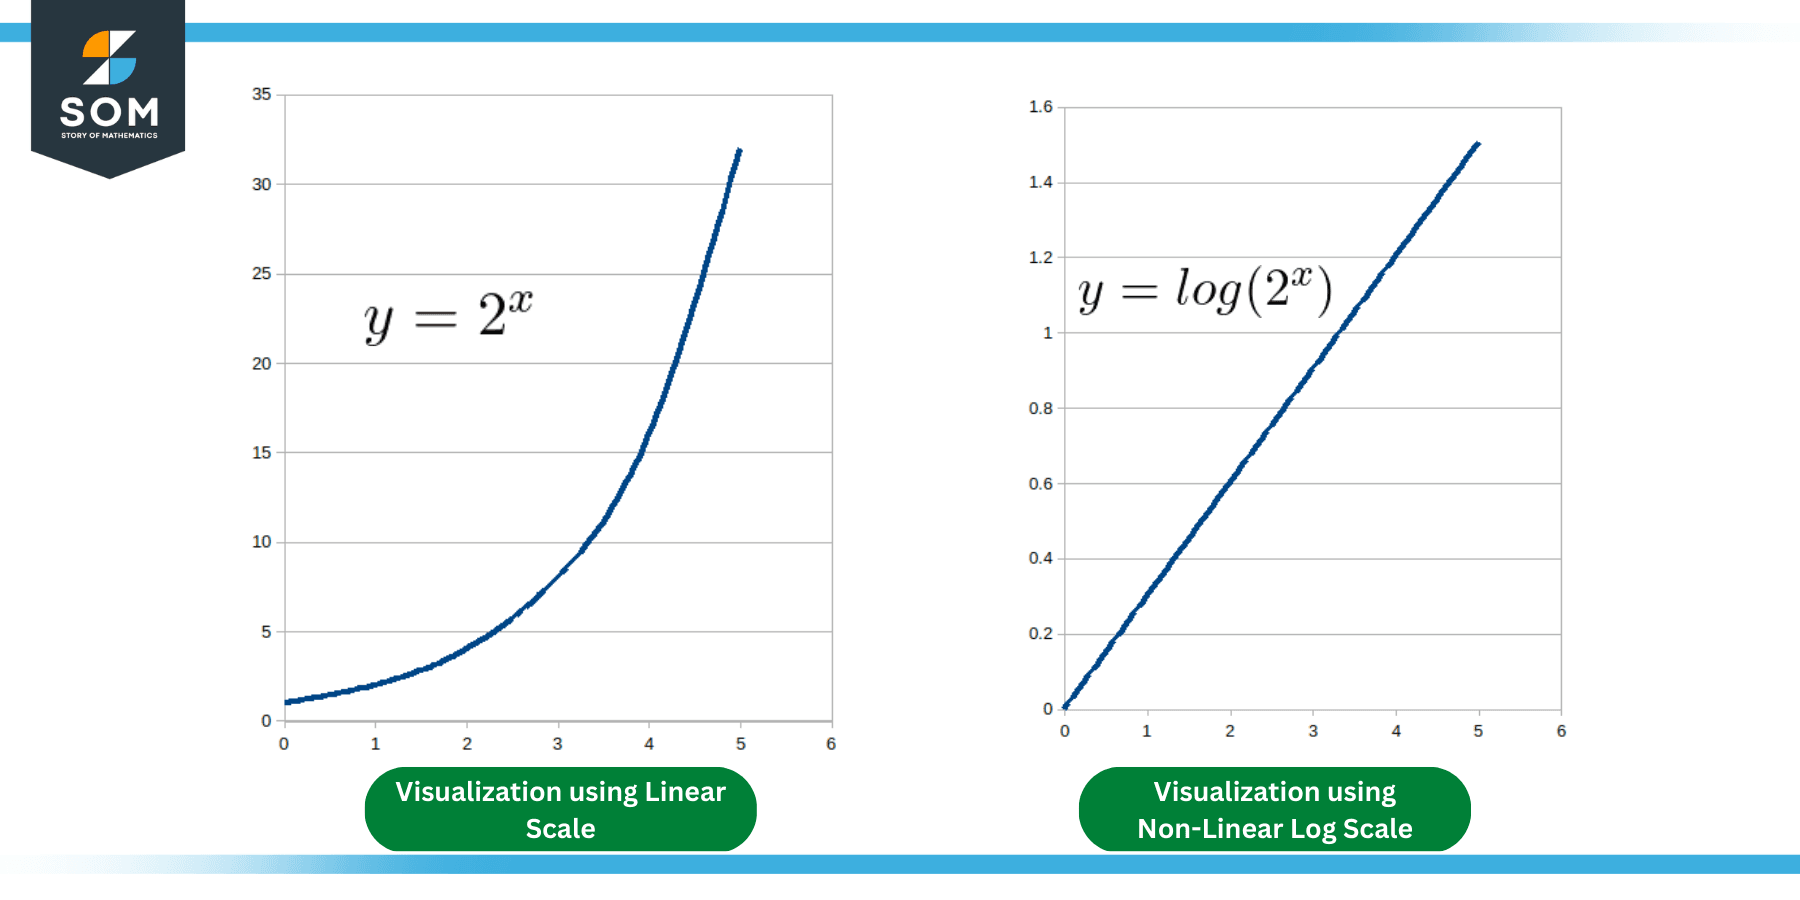
Figure 4: Visualization of Exponential Data using Non-Linear Logarithmic Equations
Non-linear S-curves
S-curve graphs are frequently used in project management to define and track the scope and advancement of a project. They can be helpful in establishing links between certain occurrences and production pauses or an increase in product flaws.
S-curves are usually compound equations that contain the addition of one or more linear, non-linear, or both types of equations. The following straightforward non-linear S-curve equation can be used as a perfect example of such curves:
y = x2 – 4x
As you may notice, it is the same curve we drew in figure 1.
Methods for Solving Non-linear Equations
Polynomials with more than one degree can be coupled to form nonlinear algebraic equations, commonly known as polynomial equations. Root-finding algorithms, for example, can be used to find solutions to a single polynomial problem (i.e., sets of values for the variables that satisfy the equation).
The study of harder systems of algebraic equations is one of the goals of algebraic geometry, a challenging subject of modern mathematics. Even determining if an algebraic system includes complex solutions can be challenging.
However, there are many efficient techniques for solving polynomial equation systems with a finite number of complex solutions.
Some commonly seen problems in complex algebra are listed below for information only.
A collection of two or more equations in two or more variables that contain at least one nonlinear equation is referred to as a system of non-linear equations. Equations that can’t be expressed in this way are known as non-linear equations.
(a) Solving a system of non-linear parabolic equations and linear equations to find their intersection point or points
(b) Solving a system of non-linear circle equations and linear equations to find their intersection point or points
(c) Solving a system of non-linear circle equations and non-linear eclipse equations to find their intersection point or points
While solving such systems, we normally use the substitution strategy that we use for linear systems. After the first equation is resolved for a single variable, the second equation is resolved for a second variable using the first solution, and so on. However, the problem is still too complex to cover here.
Numerical Example
Solve the following non-linear quadratic equation for the values of x:
x2 + 10x +1 = 0
Solution
Comparing the given equation with the standard quadratic equation:
a = 1, b = 10, c = 1
Using the following formula for the solution of quadratic equations:
\[ x = \dfrac{ – b \pm \sqrt{ b^2 – 4ac } }{ 2a } \]
Substituting values:
\[ x = \dfrac{ – (10) \pm \sqrt{ (10)^2 – 4(1)(1) } }{ 2(1) } \]
\[ x = \dfrac{ – 10 \pm \sqrt{ 96 } }{ 2 } \]
\[ x = \dfrac{ – 10 \pm 9.8 }{ 2 } \]
\[ x = \dfrac{ – 19.8 }{ 2 }, \dfrac{ -0.2 }{ 2 } \]
x = = -9.9, -0.1
All images were created with GeoGebra.