JUMP TO TOPIC
Chances and probability also have a straightforward relationship: the odds of an occurrence are the ratio of the odds that the result will occur to the odds that it won’t. In typical notation, s is the outcome’s probability, whereas 1-s is the probability that the outcome does not occur. By looking at the results of rolling a six-sided die, odds can be shown.
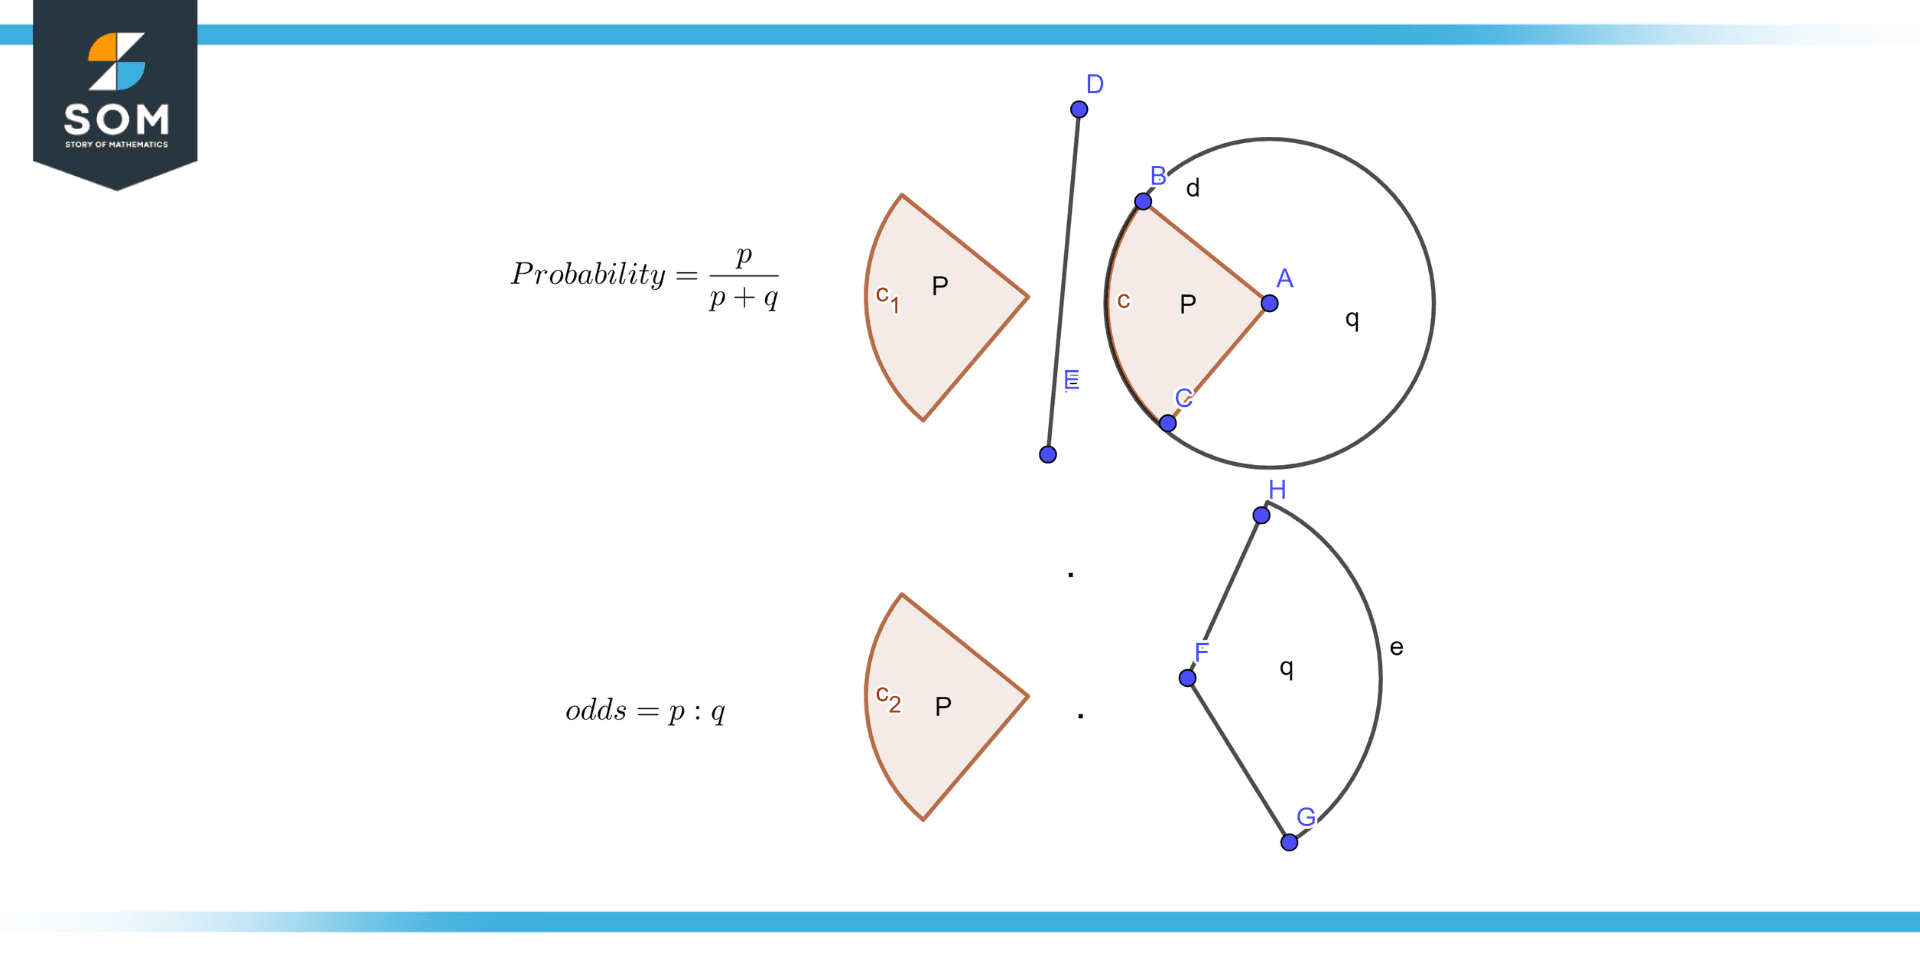
Figure 1 – Probability and odds
Figure 1 illustrates the difference between probability and odds.
There is a 1:5 chance of rolling a 6. This is since 1 event (rolling a 6) results in the desired outcome of “rolling a 6,” whereas 5 other events do not (rolling a 1,2,3,4, or 5). The likelihood of rolling a 4 or 5 is 2:4. This is since only 2 occurrences (rolling either a 4 or 5) result in the desired outcome of “rolling either a 4 or 5,” whereas 4 events do not (rolling a 1, 2, 3 or 6).
If neither a 4 nor a 5 is rolled, the chances are 4:2. This is because there are four events—rolling a 1, 2, 3, or 6—that result in the desired result of “not rolling a 4 or 5,” and only two that do not (rolling a 4 or 5).
Even though the likelihood of an event is distinct from the odds, they are connected and may be estimated from one another. The percentage of total occurrences over the number of events, or 2/(2+4), which is 1/3, 0.33, or 33%, determines the likelihood of rolling a 4 or 5.
Difference Between Probability and Odds
The percentage of times you anticipate seeing a certain occurrence across many trials is the chance that it will happen. Probabilities are always in the 0 to 1 range. Odds are calculated by dividing the probability that an event will occur by the probability that it will not occur. Figure 2 illustrates the graphical representation of odds and probability.
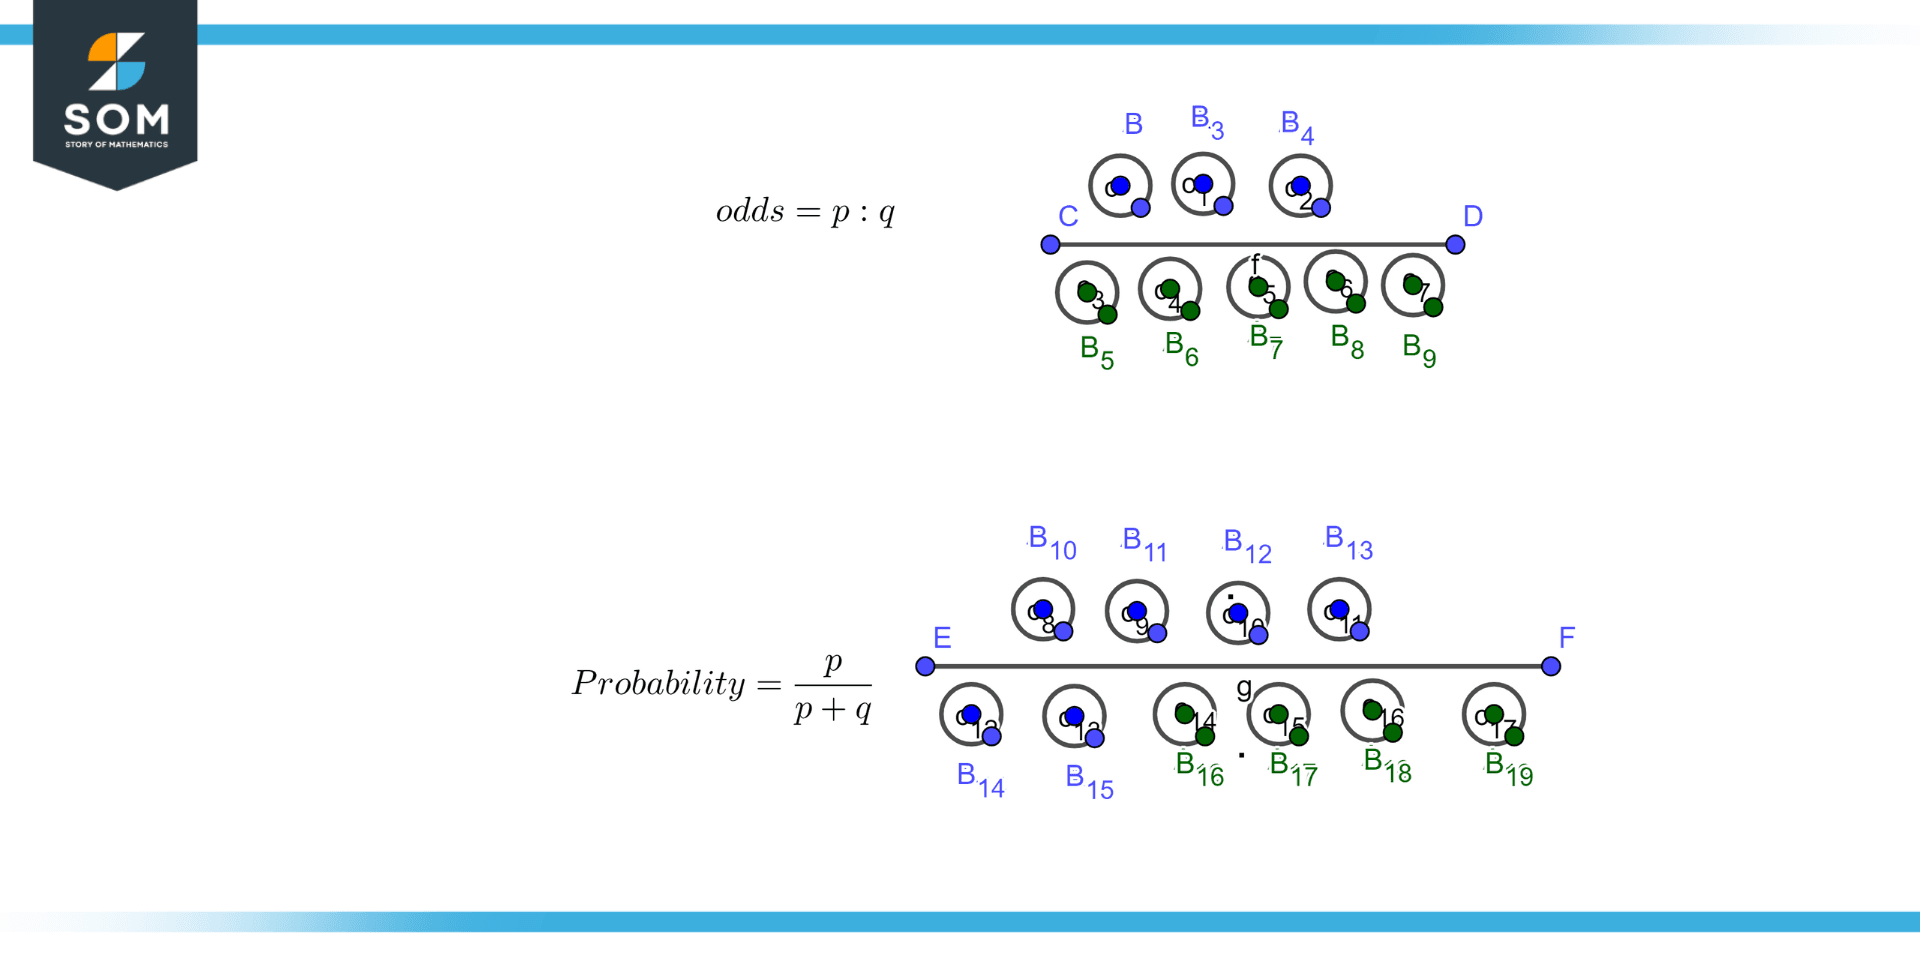
Figure 2 – Graphical representation of probability and odds
Odds in Statistics
In statistics, odds are a way to convey relative probabilities; they are sometimes referred to as “the odds are on your side.” The ratio of the likelihood that an event will occur to the likelihood that it won’t occur is known as the odds (in favour) of an event or proposition.
Since there are only two outcomes, this is a Bernoulli trial, mathematically speaking. This is the ratio of the number of outcomes with a desired event to the number of outcomes without it. For a finite sample space with equal probabilities, we can write them as S and F (success and failure) or W and L (wins and losses).
The probability that a randomly selected day of the week falls on a weekend, for instance, is two to five (2:5). This is because the days of the week form a sampling space of seven possible outcomes, and the event only happens on Saturday and Sunday, as opposed to the other five.
In contrast, a probability space with a finite number of equally likely events may be used to describe odds as a ratio of integers. The prepositions and it can be used to express odds and probability in prose.
For example, ”Too many odds for (or against) and too many odds for [event]” refers to odds that are the ratio of the number of (equally likely) outcomes for or against (or vice versa). point. “So many [outcomes] odds, so many [outcomes]” refers to probability, which is the number of (equally likely) outcomes.
For instance, “chances of a weekend are 2 in 7,” but “odds of a weekend are 2 to 5″.
Application of Odds
Odds and comparable ratios may be more intuitive or practical in probability theory and statistics than probabilities. The log odds is sometimes employed in these situations.
The most straightforward way to multiply or divide odds is to use a log, which transforms addition from multiplication and subtraction from division. This is crucial in the logistic model because the target variable’s log odds are created by linearly combining the observed variables.
Similar ratios are employed in other areas of statistics; the likelihood ratio in likelihood statistics, which is utilized as the Bayes factor in Bayesian statistics, is of essential significance. Odds are very helpful in sequential decision-making issues, such as how to halt (online) on last specific event problems that are resolved by the odds algorithm.
An odds ratio is a ratio of odds or a ratio of probability ratios, and odds are a ratio of probabilities. Odds ratios are commonly used in clinical trial analysis. Although they possess useful mathematical properties, they can also lead to results that defy common sense.
For example, an event with an 80% chance of occurring is 4 times more likely to occur than an event with a 20% chance of 16 times larger than the likely event. (1-4 or 4-1 or 0.25). Figure 3 shows the odds formula.
Figure 3 – Formula of odds
Some Examples of Odds
Example 1
Find odds in favor of throwing a die to get five.
Solution
The total number of outcomes when a die is rolled is Six. The number of times the outcome is five is equal to one, and the number of unfavorable outcomes is (6-1) =5. So odds in favor of throwing a die to get five is 1:5.
Example 2
Find odds in throwing a die and getting a five.
Solution
The total number of outcomes when a die is rolled is Six. The number of times the outcome is five is equal to one, and the number of unfavorable outcomes is (6-1) =5. So the odds in against throwing a die to get five is 5:1.
All images were created using GeoGebra.