JUMP TO TOPIC
Overview
![]()
Figure 1 – Percentile Rank Overview
A technique to express a score’s value with respect to a distribution of scores is through the percentile rank. It is a method of contrasting one score with a group of scores that is frequently used in statistical analysis. When comparing student performance to that of their peers, the percentile rank is frequently employed in education.
It is also used in various disciplines to assess how well people or groups are performing, including psychology and finance.
For instance, if a student achieves a score in the 90th percentile on a standardized examination, they outperformed 90% of the other test-takers. On the other hand, if a student has a score in the 10th percentile, they outperformed just 10% of the other pupils.
How to Calculate Percentile Rank
To calculate the percentile rank of a value in a data set, follow these steps.
![]()
Figure 2 – Method to Find Percentile Rank
Percentile Rank = $\dfrac{p}{100(n+1)}$
- Establish the value’s percentile before attempting to rank it. The p-value is 70, for instance, if the value is in the 70th percentile.
- The number of values in the data collection is counted. In the formula, the letter n stands in for this value.
- To find the product of n+1 and 100, multiply n+1 by 100.
- P-value is divided by the sum of n+1 and 100. The value’s percentile rank is the outcome.
Calculating Percentile
To calculate the percentile of a given value in a list of values, you can follow these steps.
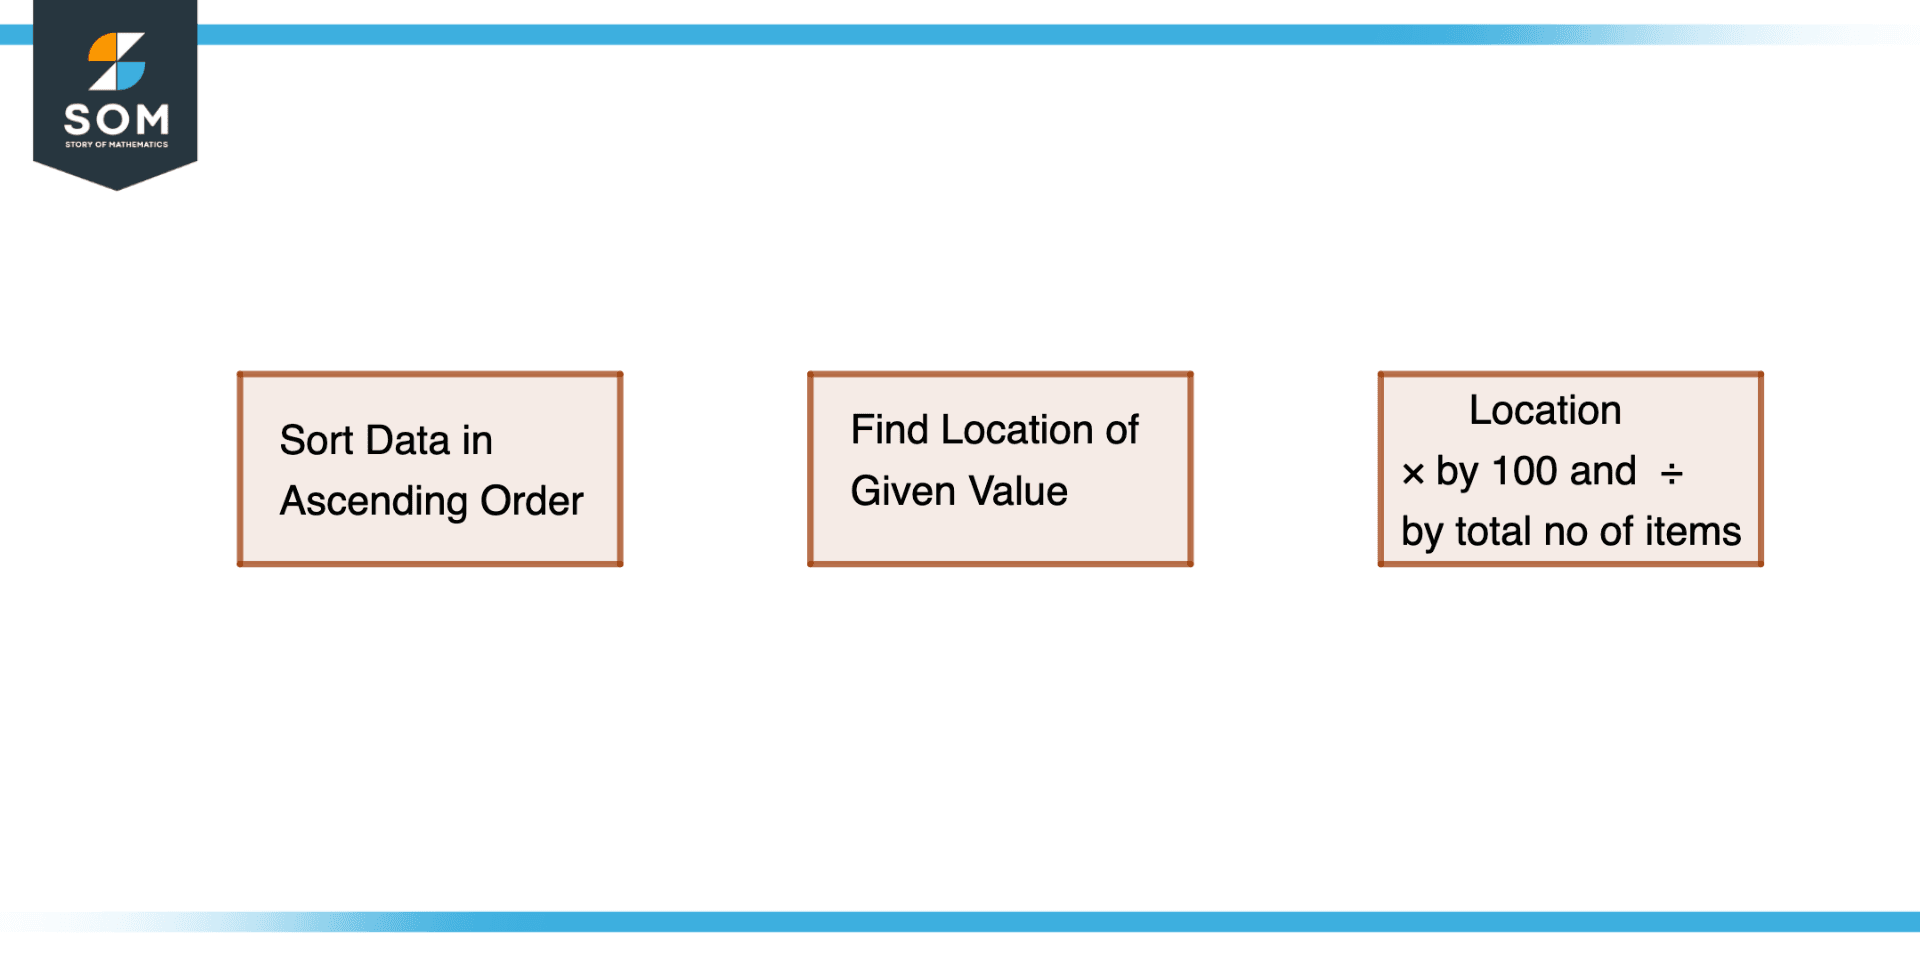
Figure 3 – Method to Find Percentile of a value
- The values list should be sorted in ascending.
- Discover where the provided value is located in the sorted list. By counting the number of values in the list that are lower than the supplied value, the position can be determined.
- The position can then be multiplied by 100 and divided by the total number of items in the list to determine the percentile of the supplied value.
Difference Between Percentile and Percentile Rank
The value at a specific location in the data set when the data are ordered from least to largest is the percentile of a given value in a collection of data. For instance, if a data set’s 30th percentile is 7, it indicates that 30% of the values are less than or equal to 7.
The percentage of values in a data collection that is equal to or less than a given value is what is known as a value’s percentile rank. For instance, if a data set’s percentile rank of 7 is 30, it signifies that 30% of the values are either equal to or lower than 7.
Properties of Percentile Rank
To summarize, the percentile is a value in the data set, while the percentile rank is a measure of the value’s relative standing in the data set.
- A measurement of one’s position in relation to a group of values is the percentile rank. It shows the proportion of the set’s values that are either equal to or lower than a particular value.
- A value between 0 and 100 is used to represent the percentile rank in all instances. The lowest value in the set is represented by a percentile rank of 0, and the highest value in the set is represented by a percentile rank of 100.
- The distribution of the values in the set has no bearing on the percentile rank. It simply depends on where the provided value falls in relation to other values in the set.
- To compare the position of several values inside a set, utilize percentile rank. The second value is higher in the set because it is ranked higher, for instance, if one value has a percentile rank of 75 and another value has a percentile rank of 90.
Applications of Percentile Rank
Percentile rank has a variety of applications, including:
- Educational assessment: To compare students’ performance on tests or other assessments, percentile rank is frequently employed in educational contexts. On a standardized test, a student’s percentile rank can show how they did in comparison to other students who also took the test.
- Human resources: Percentile rank can be used to compare job candidates’ qualifications throughout the hiring process. The percentile rank of each candidate’s result, for instance, might be used to identify which candidates are most suited for a position if the position demands a specific score on a skills test.
- Medical study: To compare the health results of various groups of people, percentile rank is frequently employed in medical research. For instance, a study may analyze the percentile ranks of blood pressure readings in various age groups to see if any age groups are more likely than others to develop hypertension.
- Marketing: Percentile rank can be used to compare the effectiveness of various products or marketing strategies. To determine which goods are performing the best, a corporation can, for instance, analyze the percentile ranks of sales numbers for several products.
- The percentile rank is frequently used in sports statistics to contrast the effectiveness of players or teams. A player’s percentile rank in a specific statistic, like scoring average or rebounding, for instance, can show how they stack up against other players in the league.
Real-life Examples
Example 1
The pediatrician is attempting to ascertain the relative location of a 12 pounds weight within the range of weights for infants who are 9 months old. In order to understand how this weight relates to other weights in the sample of 9-month-old infants, they want to know what proportion of the weights are lower than this weight.
The pediatrician wants to use data on the weight distribution of healthy newborns at nine months of age to determine the percentile rank of a certain weight within this distribution. In this case, there are six values below 12 pounds and the total number of measured 9-month-old weights is 40. How will the pediatrician find the percentile rank?
Solution
![]()
Figure 4 – Example of a pediatrician trying to calculate percentile rank
First, we will find the percentile by the following formula:
Percentile = $\dfrac{\text{No of data points below value}}{\text{Total No of data points}} \times 100$
Percentile = $\dfrac{6}{40} \times 100$
Percentile = 15
Percentile Rank = $\dfrac{16}{100(40+1)}$
Percentile Rank = 3.90
This indicates that out of the 40 infants the pediatrician weighs, 3.90% of all weights are at or below the weight of 12 pounds.
Example 2
Find the percentile rank of a student’s score on a test where the average score is 80, and the standard deviation is 10. The student scored a 90 on the test.
Solution
Percentile Rank = $\dfrac{100 \times (\text{score}-\text{average score})}{ \text{standard deviation}}$
Plugging in the values from the example, you get:
Percentile Rank = $\dfrac{100 \times (90-80) }{10}$
This simplifies to:
Percentile Rank = $\dfrac{100 \times 10 }{10}$
Which gives a final answer of:
Percentile Rank = 100
This means that the student scored higher than 100% of the other students who took the test, so their score is in the top percentile.
All mathematical drawings and images were created with GeoGebra.