JUMP TO TOPIC
The value of the data is expressed as counts or numbers in quantitative data, and every data set has its own specific numerical value.
This data refers to any information that may be quantified and used by researchers for the sake of mathematical computations and statistical analysis, with the end goal of basing real-world judgments on the conclusions drawn from these mathematical derivations.
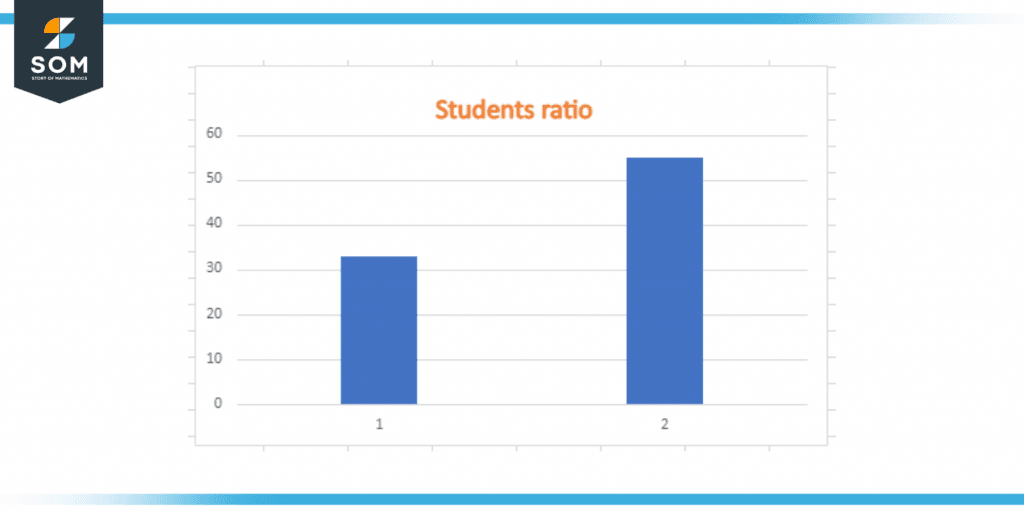
Figure 1 – Bar graph of student ratio
As an illustration, there are quantities that correlate to the many different parameters. For instance, a question like “How much did this laptop cost?” is an example of a quantitative data collection inquiry.
Most measuring parameters have values majority of measuring parameters have values that are connected with them, including pounds or kilograms for mass, dollars for cost, and so on. The below figure represents the quantitative data in form of a dot plot figure.
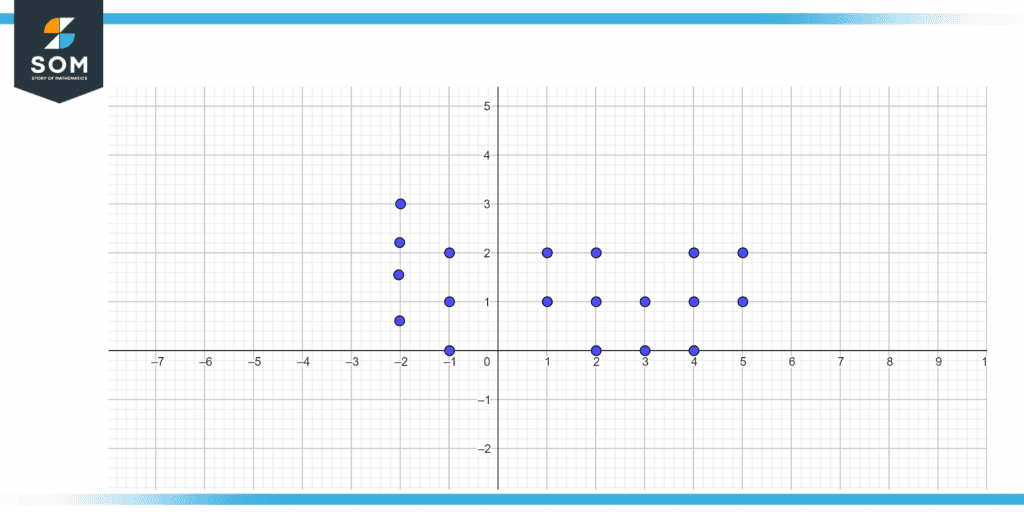
Figure 2 – Dot plot representation
Because the mathematical derivations that come with them are so simple to work with, it makes it possible to manipulate the many parameters that are being measured.
It is typically gathered for the purpose of statistical analysis through the use of polls or questionnaires that are distributed to a certain subset of a population. Researchers are able to determine whether or not the retrieved results are representative of a population. The figure below represents the stem leaf plot.
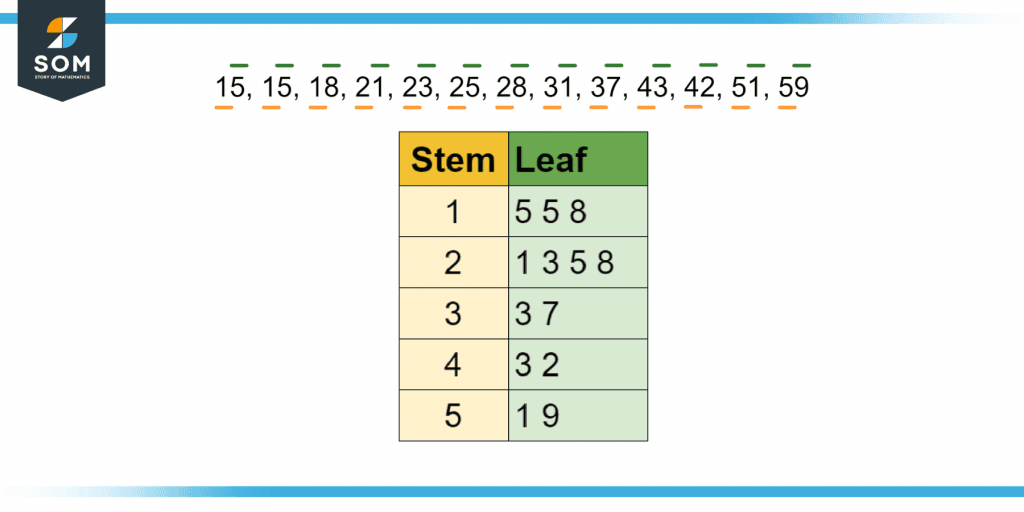
Figure 3 – Steam and leaf plot for quantitative data.
List of Quantitative Information Categories With Examples
The following are the most prevalent varieties of quantitative values:
Counter
Entities counted as one. A good example would be the popularity of an app as measured by its downloads on the App Store.
Physical Object Dimensions
Determine the exact size of a real object using a calculator. In one scenario, a human resources manager makes sure each new hire’s cubicle is just the right size.
Sensory
Sensory calculation refers to a mechanism that can “sense” the measured parameters in order to generate a reliable data stream. For instance, the electromagnetic data captured by a digital camera is transformed into a series of numbers.
Information Projection
Algorithms, together with other mathematical analysis techniques, can be used to project data into the future. A marketer, for instance, might do an in-depth investigation and forecast an uptick in sales following the introduction of a brand-new product.
Finding a Number for Intangible Things
Connect qualitative data with numerical indicators. In an online survey, for instance, respondents could be asked to rate the likelihood of a recommendation from 0 to 10.
Types of Quantitative Data
Quantitative data comes in two main forms which are as follows:
discrete and continuous.
Discrete Data
Quantitative data which can only be a certain number is called “discrete data.” There is no way to break these values down. Counting something gives you discrete data. One illustration of discrete data is that a person seems to have three children. There is a set number of children, so they can’t have, speak, 3.2 children.
The number of people who visit your website is another illustration of discrete quantitative data. You could have 150 people visit your site in one day, but not 150.6. Most of the time, tally charts, bar graphs, as well as pie charts are used to show discrete data.
Continuous Data
In contrast hand, there is no limit to how many times you can break up continuous data into smaller pieces. This kind of data can be put on a scale, like the length of such a string piece in centimeters or the heat in degrees Celsius. Basically, continuous data can have any value; that’s not restricted to fixed values.
Also, continuous data can change over time. For example, the room temperature would then change during the day. Usually, a line graph is used to show continuous data.
Examples of Quantitative Information
Here are some numerical examples that may shed light on the topic at hand:
- During the past three months, I have updated my phone six times.
- During the past year, my adolescent has gained three inches in height.
- Eighty-three users installed the newest mobile app.
- Over the course of last year, my aunt shed 18 pounds.
- There were 150 people who thought the new product feature would fail.
- An additional 30% in earnings is expected after a new product is introduced.
- The event was attended by 500 participants.
- There is a clear preference for online shopping, with 54% of consumers choosing this method over a trip to the mall.
- This is the year with the most vacation days for her, with a total of 10.
- The price of a single X is $1,000.
As you can see from the 10 examples above, each parameter is given a number value. This is called quantitative data.
The Benefits of Quantitative Data
Some benefits of quantitative data include:
Thoroughly Researched
Since quantitative analysis can be done statistically, it’s likely that the research will be thorough.
Minimal Bias
There are times when personal bias gets in the way of research and leads to wrong results. Because quantitative data is made up of numbers, there is much less room for personal bias.
Very Accurate Results
Because the results are based on facts, they are very accurate.
The Downsides of Relying on Quantitative Data
The following are some of the drawbacks of using quantitative data. Because the quantitative approach isn’t really descriptive, it is challenging for researchers to take decisions based only on the information that has been obtained. This makes it challenging for researchers to make decisions.
Depends on the Types of Questions
The kinds of questions used to collect quantitative information can influence the degree of bias in the results. During the process of gathering quantitative data, it is of the utmost importance that the researcher has a thorough understanding of the questions being asked and the purpose of the research.
When doing an investigation, one of the best ways to get reliable results that help you make better decisions is to use quantitative data. In short, statistical analysis is based on quantitative data.
Data that can be measured and confirmed gives us information concerning amounts, which is data that can be quantified and expressed using numbers. A number is defined by quantitative data, whereas qualitative data includes descriptive.
Numerical Example With Quantitative Data
Example
A survey is carried out in order to collect data on the number of hours, on average, that people spend watching football matches each week. The findings are as follows:
- 15 individuals have reported watching between 0 and 9 hours per week.
- There are 12 people who report viewing between 6 and 10 hours per week, and
- There are 8 people who report watching between 11 and 15 hours per week.
- Five persons have said that they watch for at least 16 hours every week.
What is the quantitative data in this question?
Solution
Within the context of the above-given information, the quantitative approach (hours per week) is just being gathered and quantified, turning it into an example of quantitative data.
All mathematical drawings and images were created with GeoGebra.