JUMP TO TOPIC
Figure 1 below shows a representation of qualitative data.
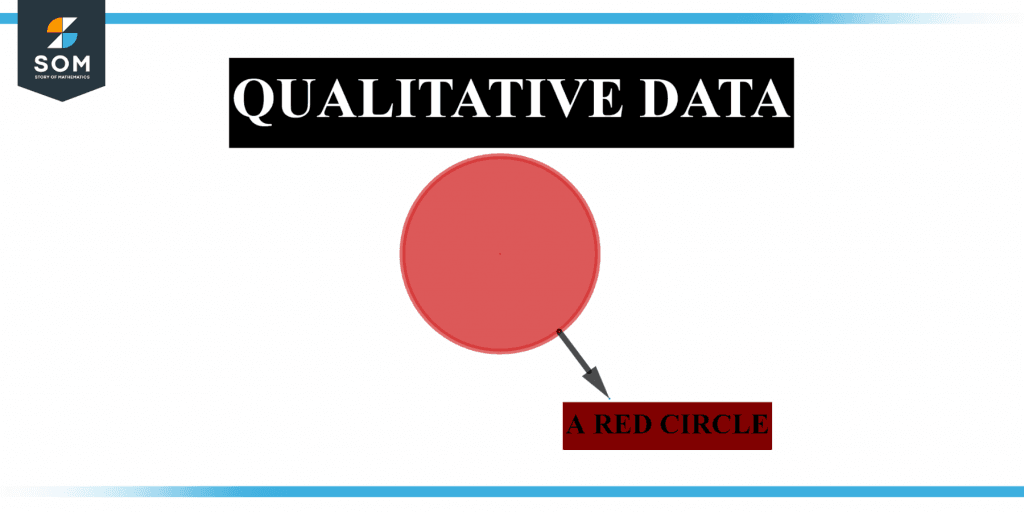
Figure 1 – Representation of qualitative data.
Categorical Data
Categorical data is statistical data made up of ordinal data translated into categories. A grouped data set is one example. Categorical data can be obtained from countable qualitative data analysis or quantitative research aggregated into defined intervals. A probability table is created to summarise these facts.
However, when discussing data analysis, the phrase “categorical data,” which applies to data sets, is used. It should also be emphasized that the data collection may contain non-categorical variables and category variables.
Categorical data is data that has been categorized.
- The qualitative elements of the acquired raw data are used to group the data.
- Colors, age groups, culinary cuisines, sports, genders, forms, and so on are examples of qualitative elements.
- This is not to say that categorical data is unrelated to numerical values.
- Categorical data may incorporate numerical values in some circumstances to define the value of categorical variables.
Qualitative Data
Qualitative data consists of categorical variables that reflect attributes like a person’s gender, birthplace, and so on. Qualitative data measures are expressed in natural language descriptions rather than numerical values. Qualitative data can occasionally have numerical values, but such numbers have no mathematical significance. Some instances of qualitative data include:
- Favorite sport
- Birthday
- School Postcode
- Method of transportation to and from school, etc.
Types of Qualitative Data
Qualitative data consists of values and observations that may be categorized or grouped. These facts are best represented using bar pie charts and graphs.
Figure 2 below shows that qualitative data is further subdivided into two types.
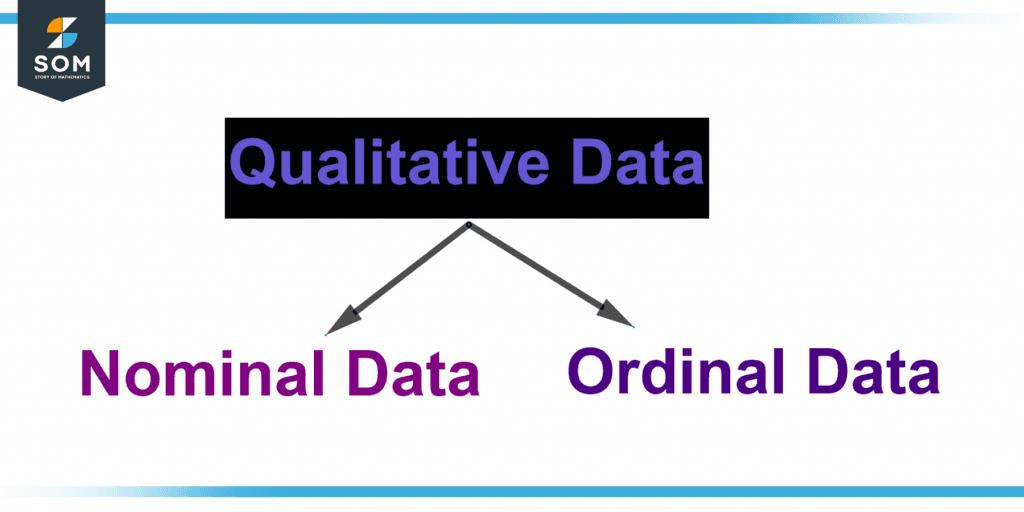
Figure 2 – Types of qualitative data.
Nominal Data
“Nominal” is taken from the Latin “Nomen,” which means name.
Thus, nominal qualitative data comprises “named” or “labeled” data that does not consider the numeric values of the data. Instances of nominal qualitative data include various literary genres such as fiction and sci-fi, flower types, color tints, and so forth.
Nominal data is data in which variables are labeled, but no numerical value is provided. It is often referred to as the nominal scale. Ordering and nominal measuring data are impossible.
However, nominal data can be both qualitative and quantitative at times. Some frequent instances of nominal data include letters, words, symbols, gender, etc.
The grouping approach is used to analyze this data. The variables are categorized, and the percentage and frequency may be determined. The pie chart can be used to illustrate it visually.
Figure 3 below shows a pie chart for nominal data.
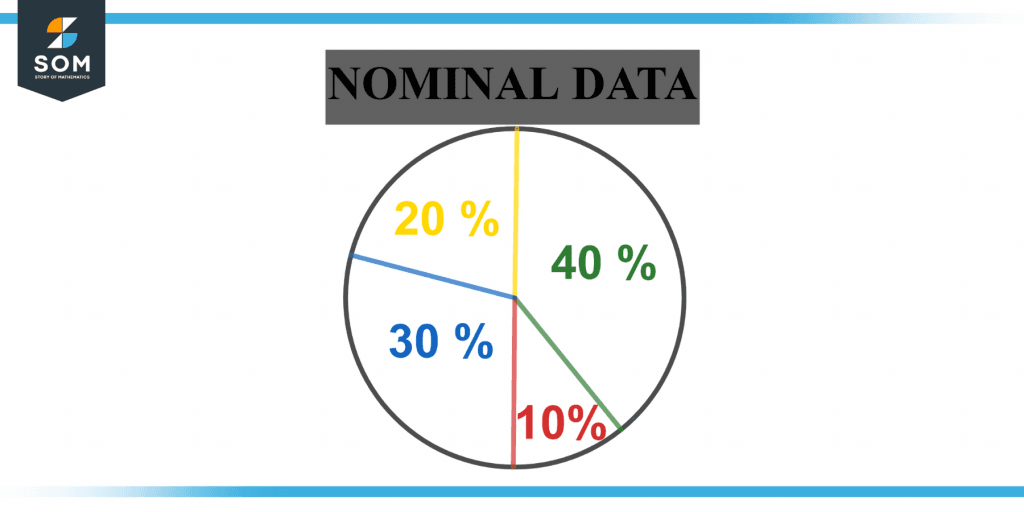
Figure 3 – Representation of nominal data.
Ordinal Data
Ordinal data is data that has a natural order to it. Ordinal data is distinguished because the difference among data values can’t be identified. It is frequently used in surveys, questionnaires, finance, and economics.
Visualization tools can be used to analyze the data. A bar chart is typically used to depict it. Tables sometimes represent data, with each row representing a separate category.
Ordinal qualitative data has a specific “scale” and “measure” for the data. The scale is only sometimes precise or consistent.
This type of information is usually arranged or quantified. Because numerical values are included, this form of qualitative data is considered to have both categorical and numerical features. They may be evaluated by grouping and visually depicted using bar graphs.
One example is a survey that uses numerical values to compare grouped data under category factors.
Qualitative Variables
A qualitative variable has many values under various names or labels in grouped category data. A qualitative variable is the fundamental attribute of data that is grouped into a specific category.
A qualitative variable has a restricted and typically fixed number of potential values. They accept values that are often names or labels. An example is the shade of a wall, such as red, blue, pink, or green.
People’s genders, such as male, female, and transgender
A person’s blood group: O, AB, A, B, and so on.
Based on some qualitative quality, these variables are employed to assign each human or another unit of measurement to a certain group or nominal category.
Each categorical variable’s potential value is generally referred to as a level. Categorical distribution refers to the confidence interval linked to a random categorical variable.
Qualitative and Numerical Data
- Qualitative data is made up of attributes or variables labeled or given a title—for example, the type of dog, the color of a car, and so forth.
- Quantitative data consists of numbers or numerals used to represent data, such as a person’s height, weight, and age.
Example of Qualitative Data
The data below illustrates the ordinal categorical variables of the number of pupils whose birthdays occur in specific months.
January = 3
February = 4
March = 2
April = 3
May = 8
June = 10
July = 6
August = 2
September = 7
October = 8
November = 4
December = 7
Based on your observations, can you respond to the following questions?
- What’s the total number of students?
- Calculate the average for the three months having the most birthdays.
- Calculate the average of 4 months with the fewest birthdays.
Solution
Based on the findings from the observation:
1. What’s the total number of students?
Total student population = 3 + 4 + 2 + 3 + 8 + 10 + 6 + 2 + 7 + 8 + 4 + 7 = 64
2. Calculate the average for the three months having the most birthdays.
Average of the three months that had the most birthdays = (10 + 8 + 8) / 3 = 26 / 3
Where 26/3 = 8.667.
3. Calculate the average of 4 months with the fewest birthdays.
Average of the 4 months with the fewest birthdays = (2 + 2 + 3 + 3) / 4 = 10 /4
Since 10/4 = 2.5, so, on average, there are 2.5 birthdays per month for the fewest birthday months.
All images are made using GeoGebra.