JUMP TO TOPIC
If a person is interested in pursuing a career in mathematics or if one requires the methods to solve everyday problems in business, it becomes fairly important to understand and apply different formulas and solutions effectively.
If you are curious about finding the range of a particular function, there are numerous ways to carry out this operation, but it is more important that you must know about the basics of a function and its domain which results in the range of a function.
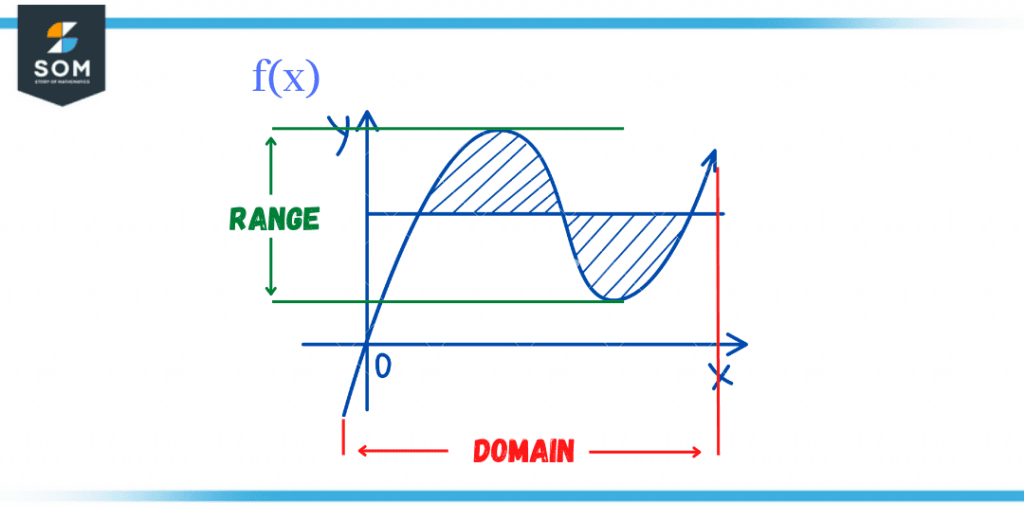
Figure 1 – Domain and Range
What Is a Function?
Any sentence or a group of letters and numbers that you see having a relational sign in between is known as a function. The relational sign can be an equal to, less than, or greater than, and so forth. It basically tells you the exact relationship between two sets of identical or distinct variables.
The mathematical expression of a function looks something like a formula:
y = f(x)
In the above expression, the left-hand side represents the dependent variable, which is dependent on the variability of the expression on the right-hand side. Thus y can be described as a function of x, which means that whenever there is a slight change in the value of x, the value of y will correspondingly change depending on the structure of the function.
Here y is also known as the range of the function, allowing us to determine the extent of a function, whereas the value x represents the domain, which can be any arbitrary value.
For instance, the simplest function can be written as:
y = x – 1
If we take x = 2 and put it in the above equation, we get:
y = 2 – 1 = 1
Similarly, changing the value of x to 10 will result in y = 10 – 1 = 9.
What Is Range?
As discussed above, the range of a function is the total extent to which the function can stand out. In simple words, a function requires a set of domain values, to predict the overall range of the function. We can define domain and range as,
Domain
It is the set of values that are injected into a function, as an input. They represent the values of x in most cases.
Range
It represents the outcome of a function, for every value of the input. In our case, y represents the range of the function based on every value of x.
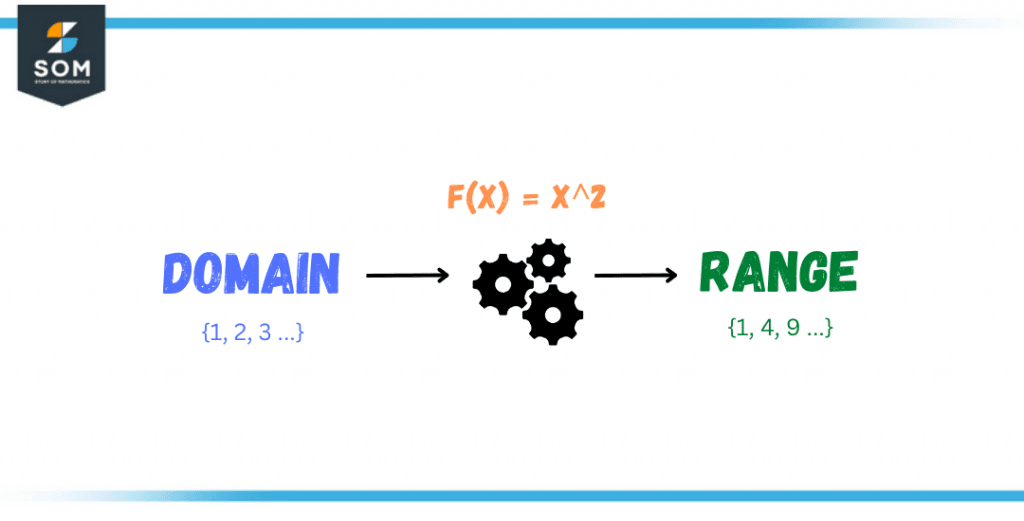
Figure 2 – Range of a Given Function
In the above figure, the function is y = f(x) = x2, which means that for every value of x, the value of y will double, thus if a set of numbers is provided to the function, let’s say {1,2,3,…}, it will give the range as the output, that is {1,4,9,…}.
How To Find the Range of a Function?
If we are to work with an ordered pair of (x,y), the value of x will only correspond to one single value of y. But for y, there can be a number of possibilities. This means that we have to find the values of y based on the given set of values of x. We will be discussing three ways to find the range, by using a formula, a graph, and by using a relationship.
By Using a Formula
The relationship between the variables x and y can be represented mathematically. Relying on the nature of the interactions between the values, these formulas can have various appearances. The procedures for finding a mathematical function‘s range are as follows,
Write the Formula
The formula can give many aspects which help in determining the relationship between different variables. Such a formula can be y = f(x). Let’s say you sell tomatoes for 1$ each, so your total sales depend on the number of tomatoes sold multiplied by the cost of each tomato, making a formula f(x) = 1(x). If you sell a total of 10 tomatoes, our sales will be \$10, but if you sell only 1 tomato, your sale will be \$1.
View More Coordinate Pairs
Since the sale can only be a positive function, you can go for more information by drawing ordered pairs on a graph. This will help you understand the trend, whether it is linear or upwards. This also helps to find the relationship between x and y.
Write Down the Range
Since you have already figured out that your sales cannot go negative, the range of your sales will never be lower than zero. The reason is that your sale will always tend to increase instead of go down. As you know that the sales will increase by a factor of 1, so the range will be:
f(x) = for all multiples of 1 $ge$ 0
By Using a Graph
A visual representation of a function can significantly help in determining the relationship of x and y. The procedure to determine the range using a graph is as follows,
Draw the Graph of the Function
Draw the function on graph paper by marking the x and y values using small dots. This will help in visualizing the shape of the function, whether it’s a ‘u’ or ‘n’ or any arbitrary shape.
The next step is to find the minimum, which can be located at the lowest point on the graph.
Similarly, the maximum of a function can be located at the highest point on the graph.
Figure Out the Range
The range can be always equal in relation to the domain, it may be greater than or less than a certain value. For instance, the range {-1,1,2,3}, can be stated as -1 $le$ f(x) $ge$ 3.
Solved Example Using Range of a Function
For the function given below, determine the domain and range:
f(x) = 3x2 – 5
Solution
We are given a function f(x) = 3x2 – 5
The domain of this function will be the set of values we provide as an input, for which we get the output as real and defined values. Since the function has no indefinite x values, the domain of the function is going to always be real and well-defined. Thus:
Domain = D = [-$\infty,\infty $]
Now for determining the range of the function, we have to find the values of y, which are dependent on the values of x given in the function. So:
y = 3x2 – 5
3x2 = y + 5
x2 = (y+5) / 3
x = $\mathsf{\sqrt{\dfrac{(y+5)}{3}}}$
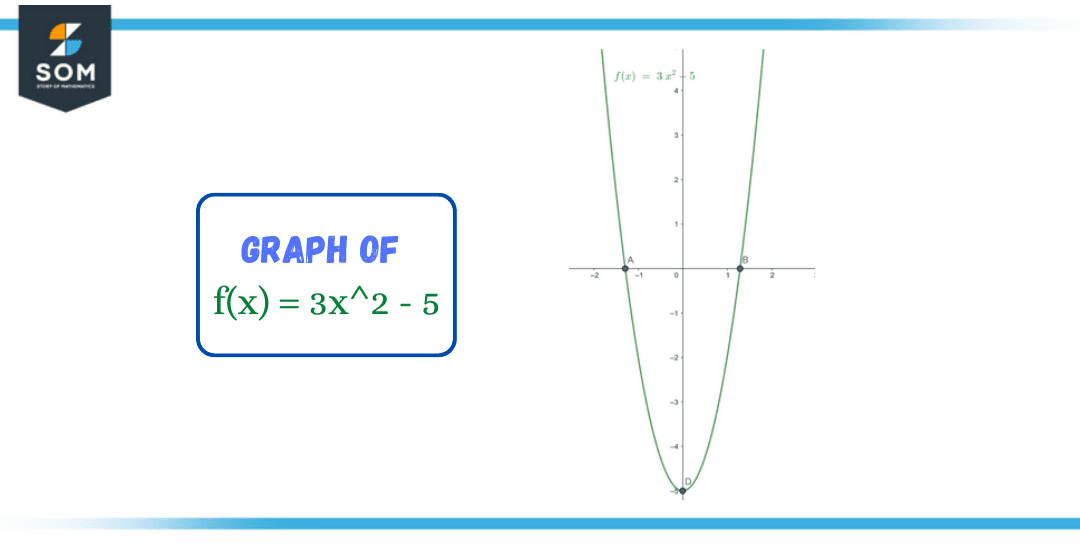
Figure 3 – Graph of example problem
For this square root to be a positive real number, y must be greater than or equal to -5.
Thus, the range of this function is [-5, $\infty$)
All images/mathematical drawings were created with GeoGebra.