JUMP TO TOPIC
A sample is a portion of very large data that is chosen for research in probability. In data analysis, sampling is frequently used to estimate population-wide features.
For instance, you might select a group of students and determine the average ages of a sample if you wanted to know the age range of all the pupils at a particular school. The age range of all the pupils enrolled in the school would then be calculated using this sample average.
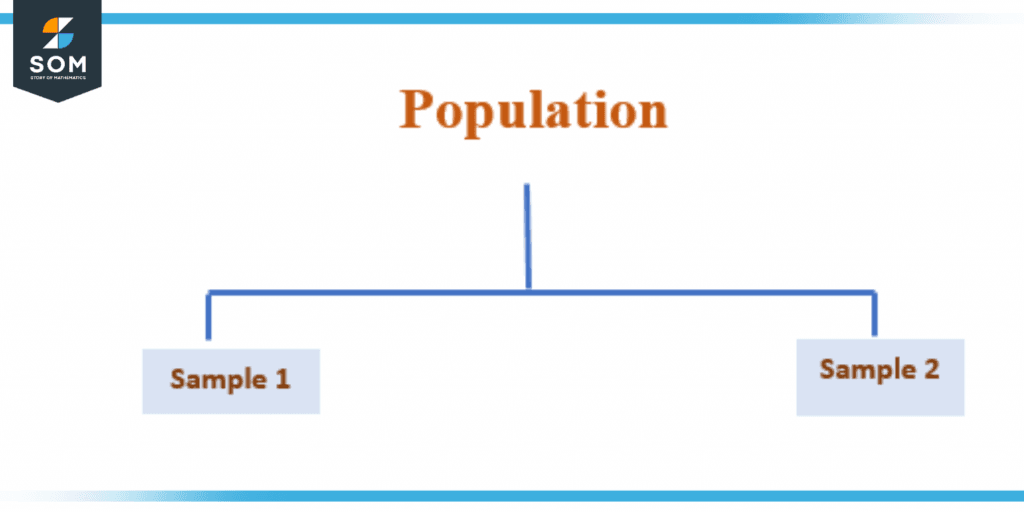
Figure 1 – Population and Sample
The results of any random experiment can be collected in the form of a sample. When we take a sample from any random variable, then it ends up with one particular value out of all of the possible outcomes for that variable. A sample is the name given to that particular value.
The probability distribution of the random variable is used to determine both the potential values and the possibility that each value will occur.
Illustration
A sample must accurately reflect the population to draw meaningful conclusions about it. In other words, the sample needs to be chosen in a way that accurately represents the traits of the population. Simple random sampling, sampling techniques, and cluster sampling are a few techniques for choosing a representative sample.
It is crucial to remember that the sample could not necessarily reflect the population. This is so that sampling error, which is the discrepancy between both the sample mean and the true population value, can affect any sample. The sampling error is more likely to be reduced the larger the sample.
A sample is a portion of a population that is chosen for statistical study in probability and statistics. Since the sample is meant to be representative of the overall population, it should have traits that are like those of the population.
The group from which you will gather data is known as a sample. The sample size is always smaller than the population as a whole. As shown in the below figure.
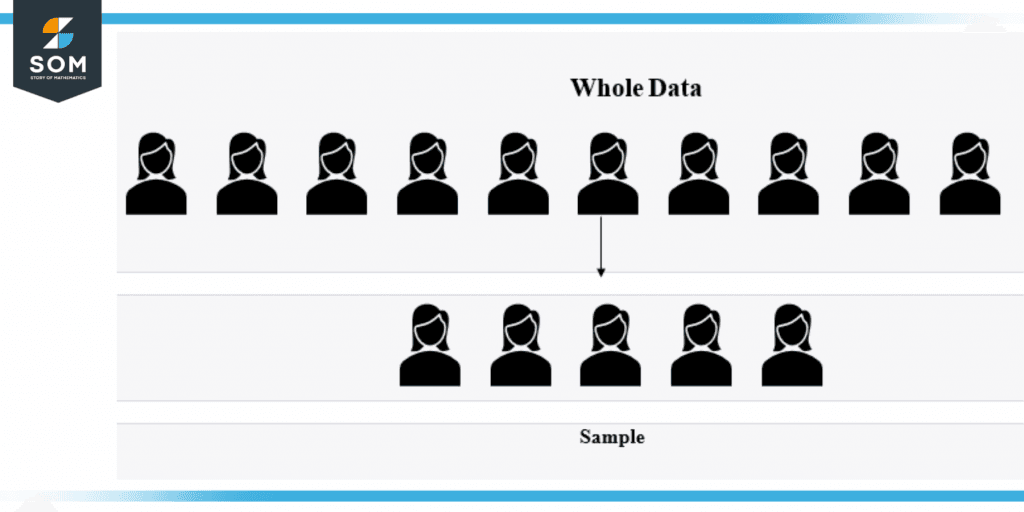
Figure 2 – Data and Sample
It is crucial to remember that for the sample to properly represent the population, it must be chosen randomly and impartially. The findings of the statistical analysis may be deceptive or erroneous if the sampling is not representative of the overall population.
Explanation
A sample is a portion of a group that is chosen for analysis in probability. Because the features of the sample should resemble those of the population, it is crucial to choose a sample that is representative of the larger population carefully.
It is crucial to select the best sampling technique based on the population’s characteristics and the study’s objectives. If the population is highly heterogeneous, for instance, stratified sampling can be more suitable. It’s also crucial to make sure the sample consists of all demographic subgroups.
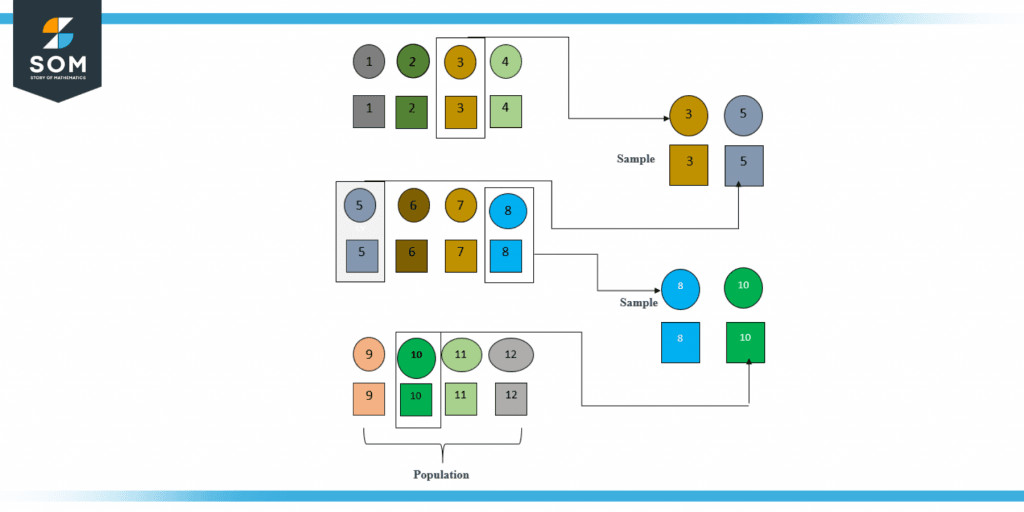
Figure 3 – Samples from Different Data
After the sample has been chosen, the sample can be statistically analyzed to draw conclusions about the population. It is crucial to understand that the sample might not be perfectly representative of the general population, which means the study’s findings might not be entirely accurate.
However, the study’s findings can be regarded as typical of the population if the sample was well-selected and sufficiently large.
Sampling In Probability
In probability, a sample is a smaller group of observations taken from a larger population. Inferences about the population’s characteristics are drawn from the sample.
For instance, you could select a student sample and measure individual heights to determine the average height over all student at a particular university or school. You may compute the average height from this sample and use that figure to get the average height of the university’s overall student body.
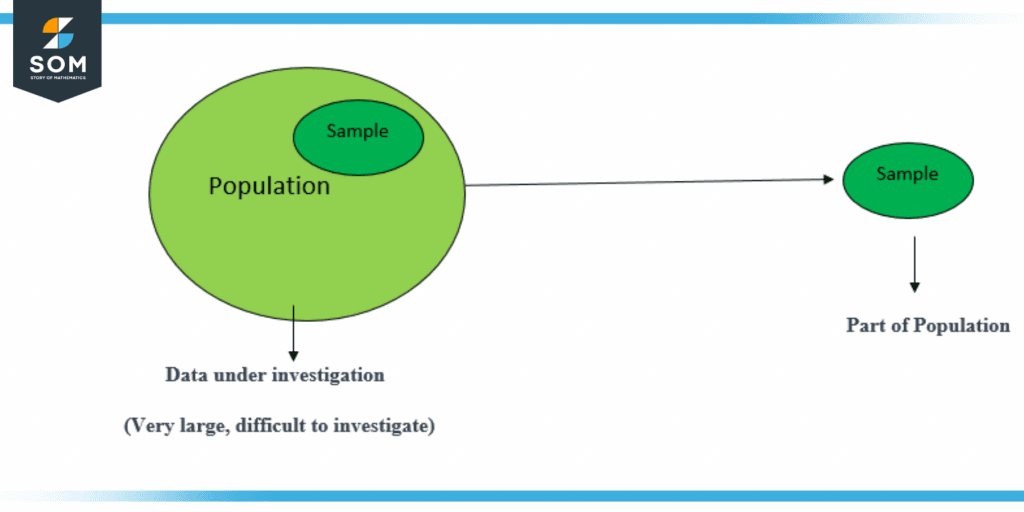
Figure 4 – Sampling of Data
The precision of the estimate might be impacted by the sample size. In general, a greater sample size than a smaller sample size will give a more accurate approximation of the population characteristics. This is so that a larger sample, which is less prone to random fluctuations, is much more representative of the population.
It’s crucial to check that the sampling is representative of the general population as well, though. The estimate could be biased and not correctly reflect the true features of the population if the sample isn’t representative.
Example of Sampling
Following are some examples of sampling.
Example 1
How many hours a week, on average, do university students spend studying?
Solution
We may ask a sample of university students how many hours they spend studying each week to find the answer to this question.
Let’s say a survey of 50 university students revealed that they study for 15 hours each week on average. This sample mean might be used to calculate the typical weekly study time for all university students.
As this estimate is based on a sample and not the total population, it is crucial to keep in mind that it might not be entirely correct. We can take a larger sample or use a more representative group of people to improve the estimation’s accuracy.
Example 2
What percentage of college students drive their own cars?
Solution
We could interview a group of university students to find out the answer to this query by asking them if they drive a car. Say we polled 150 college students and discovered that 50 of them drive. 50/150 = 0.3 is the sample percentage of university students who possess an automobile.
This sample proportion can be used to calculate the percentage of all university students who possess a car. As this estimate is dependent on sampling and not the total population, it is crucial to keep in mind that it might not be entirely correct. We can select a larger sample or use a more representative group of people to improve the estimation’s accuracy.
Example 3
Show the concept of sample and population in real life.
Solution
Population: All students in the school
Sample: A subset of the students in the school, e.g., 200 students.
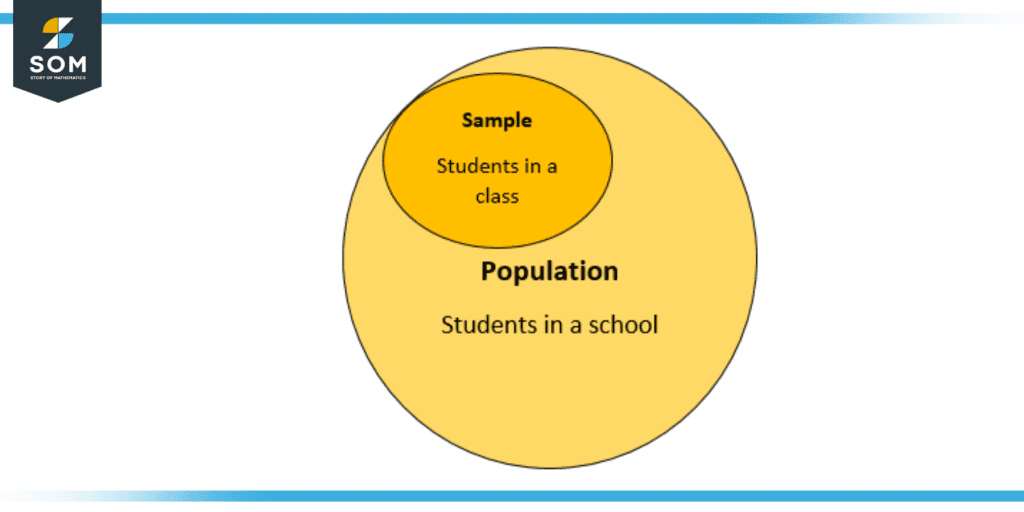
Figure 5 – Sampling of Data in School
Here all the students in the school will be population and the for sample some students from the school will be taken.
All the figures above are created on GeoGebra.