JUMP TO TOPIC
The concept of sample points has been shown pictorially in Figure 1 below:
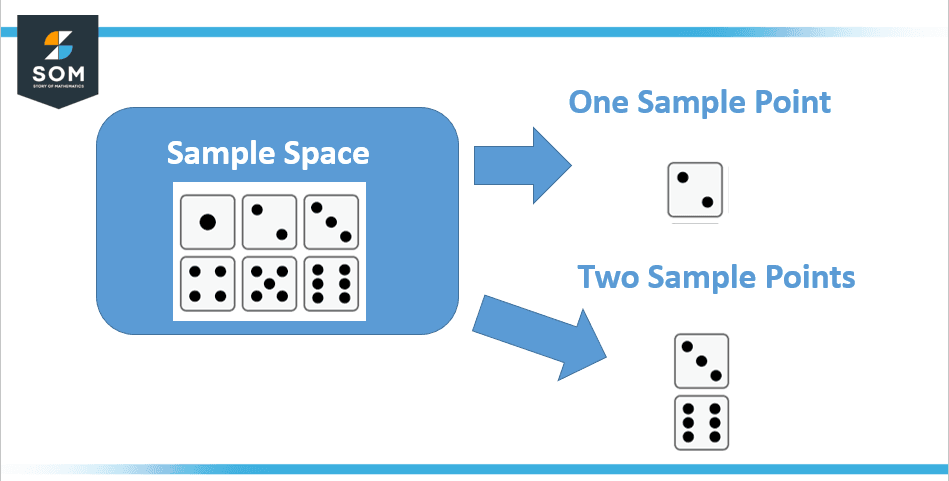
Figure 1 – Concept of Sample Point
As shown in the above figure, the observed values of the variable are the sample points. A procedure or action that includes multiple outcomes that cannot be predicted with certitude is called an experiment. It is the simplest result a test can produce. The term “sample space” refers to the collection of all sample points in an experiment.
The components of sample space, known as sample points, simulate the experiment in terms of the sample space. The sample points may alternatively be referred to as observations or sampling units. Assume that $p_i$ represents the sample point i‘s probability. Following that, the sample point probability rules will be:
- The probabilities of sample points lie between 0 and 1.
- The total of the sample points of a sample space is equal to 1.
The sample points in a sample space may be independent, distant from one another, or equally likely. They are referred to as independent sample points if the possibility of one sample point does not rely on any other sample points.
The two sample points are referred to as disconnected sample points or disjoint sample points if they have nothing in common. The sample points are said to be equally likely if every sample point in the sample space has the same possibility of appearing.
Alternative Description
A sample point is one of the experiment’s potential outcomes in a probabilistic experiment. Sample space contains all the sample points that are also called an outcome. The space is usually symbolized by the alphabet S, and a sample point is traditionally represented by small ‘s.’
Sample Point Computation
A sample point represents a result from within a sample space. It is referred to as an element or a component of the sample space as well. S = {heads, tails}, or S can also be written as S = {H, T}. The sample space is S = {HHH, HHT, HTH, THH, HTT, TTH, THT, TTT} if we toss a coin three times.
The elaboration of the sample point concept in the context of this example is shown in figure 2 below:
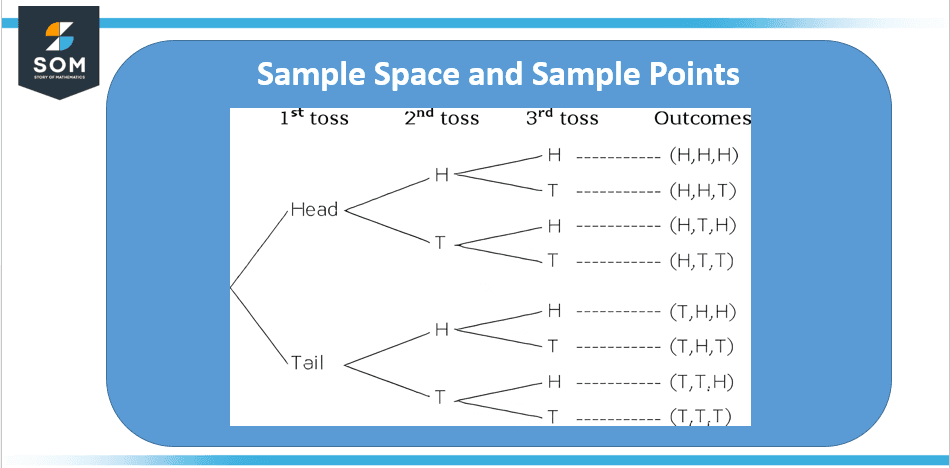
Figure 2 – Sample Points for Three Head-tail Coin Scenario
Apart from the three coins case as elaborated in the above figure, for two coins scenario, there are two feasible results when we toss a coin: head (H) or tail (T), and there are four possible effects when we toss two coins: HH, HT, TH, and TT, where the first letter denotes the result of the first toss and the second refers to the result of the second toss. Each result is known as a sample point.
Econometric Theory Perspective
The econometric theory is a branch of economics that uses statistical and mathematical methods to analyze and understand economic relationships. From an econometric perspective, a sample point is a single observation or data point that is collected and analyzed as part of a larger sample.
The larger sample is typically a subset of the population of interest and is used to make inferences about the population.
In econometrics, sample points are used to estimate the parameters of a model that describes the relationship between variables of interest. These estimates are then used to make predictions and test hypotheses about the population.
The quality of the inferences made from the sample points depends on the representativeness of the sample, the sample size, and the estimation methods used. The larger the sample size, the more accurate the estimation of parameters will be. A representative sample is also important as it helps reduce bias and increase the accuracy of the estimates.
An econometric theory provides a framework for selecting appropriate samples, designing experiments, and analyzing data. It also provides methods for testing the validity of the assumptions underlying the model and for assessing the precision and accuracy of the parameter estimates.
In summary, the econometric theory provides a perspective on how to analyze and understand economic relationships by using statistical and mathematical methods on a sample of data points and making inferences about the population based on the results obtained from the sample.
Difference Between Sample Space and Event
In probability and statistics, a sample space is the set of all possible outcomes of a random experiment. An event is any subset of the sample space. We have HH, HT, and TH if we want to list all sample points where at least one H occurs.
Any events are said to be mutually exclusive if, for any one trial of the experiment, the occurrence of one event implies the non-occurrence of the other event.
For instance, if we received a head, we could not also receive a tail. Any two events are independent, which means fundamentally different things. If there are no other conceivable events, then events are exhaustive.
For example, if you flip the coin twice, you could obtain two heads (HH), one head and one tail (HT and TH), or two tails (TT). The list of occurrences is, therefore, comprehensive.
When considering the likelihood of an event, we usually start by making a list of all the possible outcomes. The items in this list constitute a set in mathematics, which we denote by Omega. We require that Omega must fulfill the following two properties:
- Mutually exclusive outcomes where only one of the events from the sample space can happen. That is, if one event happens, then none of the events in the set can happen.
- Exhaustive outcomes where at least one of the events from the set will happen.
An event occurrence is said to as a sample space or space of all conceivable outcomes if it satisfies these two qualities. Likewise, an event in a set is called a sample point or a possible outcome. The difference between sample space, event, and outcomes have been elaborated in figure 3 below:
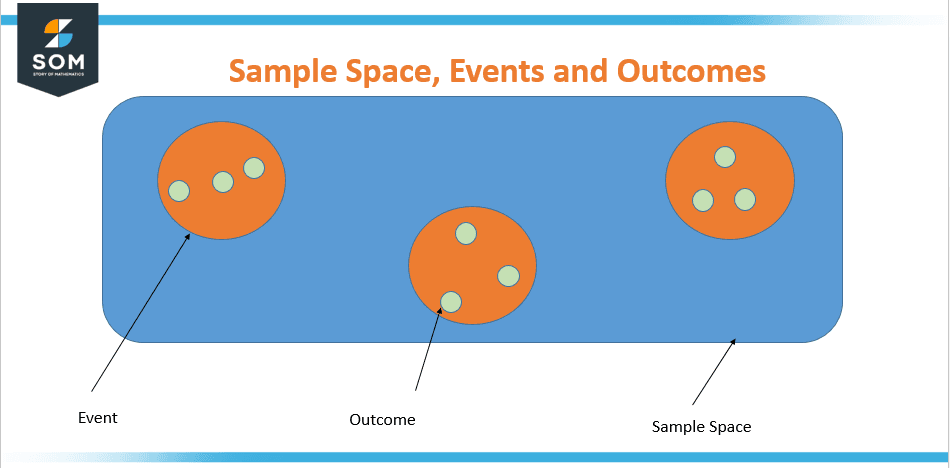
Figure 3 – Difference between sample space and event
For example, suppose we toss a die, six-sided dice numbered from 1 to 6. The sample space for this experiment is {1, 2, 3, 4, 5, 6}, which represents all the possible outcomes of the experiment. An event could be the outcome of rolling a number greater than 4. This event would include the outcomes {5, 6}, which are subsets of the sample space.
Another event could be the outcome of rolling an even number. This event would include the outcomes {2, 4, 6}, which are also subsets of the sample space.
Solved Examples of Finding the Sample Points of an Experiment
Example 1
Consider the sample space of a scenario where we toss a die. Find the sample points for this experiment.
Solution
If a die is rolled, the sample space, or feasible outcomes or effects, are as follows: There are six sample points, and they are 1, 2, 3, 4, 5, and 6.
Example 2
Consider the sample space of a scenario where we toss a single die or two coins. Find the sample points for this experiment.
Solution
For asked scenarios, sample points are given below:
- Tossing a single coin: Consider that the random experiment is a coin toss. It may result in either the tail (T) or the head (H). The two sample points are T and H, and the sample space is {H, T}.
- Tossing two coins: The sample space, or possible outcomes or consequence, for tossing two fair coins is defined as: Here, we have HH, TT, TH, HT, and TH are the four sample points.
All images/mathematical drawings were created with GeoGebra.