JUMP TO TOPIC
What Does Skewed Data Mean?
Data is considered skewed when it produces an uneven or skewed curve when plotted on a graph. A data set with a normal distribution will have a graph that is symmetrical & shaped like a bell when it is plotted. Skewed data, on the other hand, will always have a “tail” along either of the graph’s sides. The following are the two most prevalent types of skew:
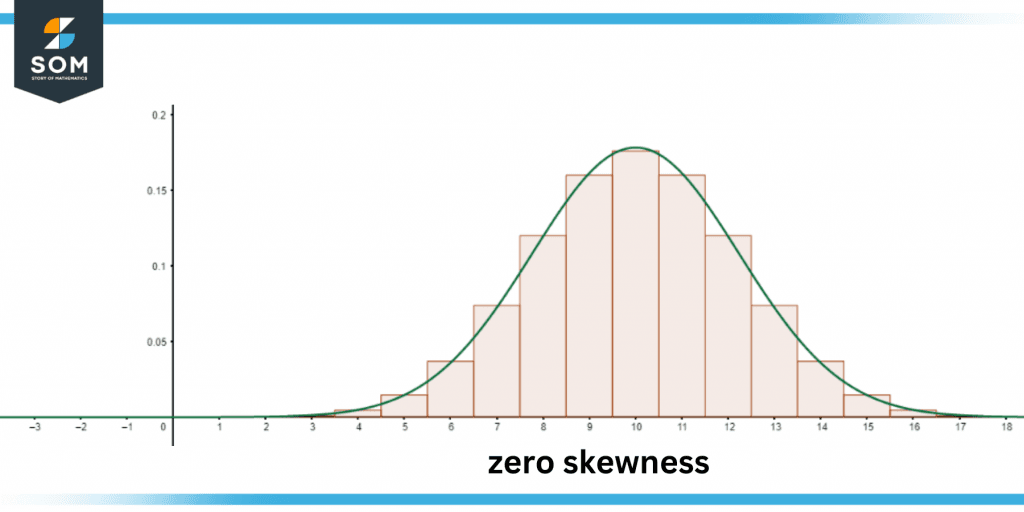
Figure 1 – Zero skewness
Negative Skew Data
A data set is said to have a negative skew if the graph’s tail is located on the negative side of the graph. This indicates that the graph is skewed to the left.
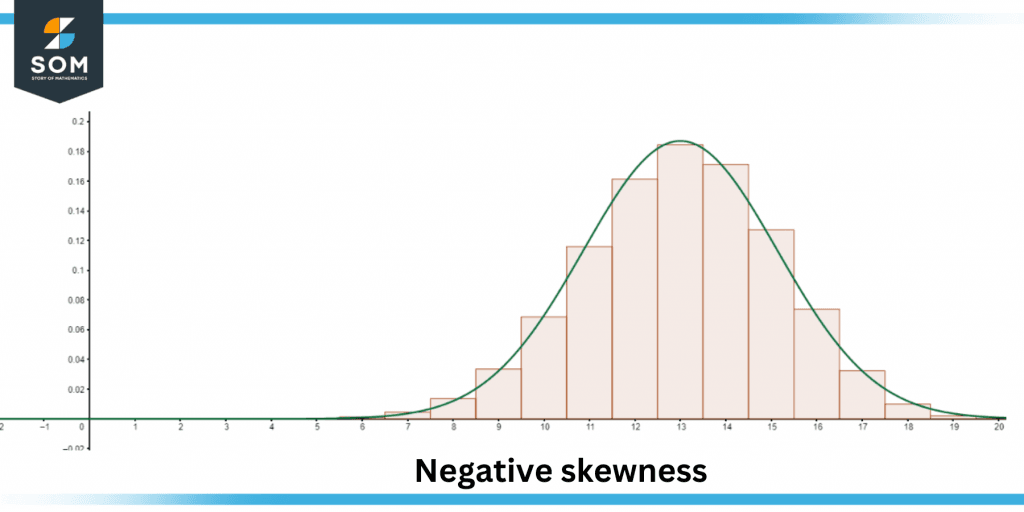
Figure 2 – Negative skewness
Positive Skew Data
A data set is said to have a positive skew if the graph it generates has a tail just on the positive side of the graph, which indicates that the graph is skewed to the right.
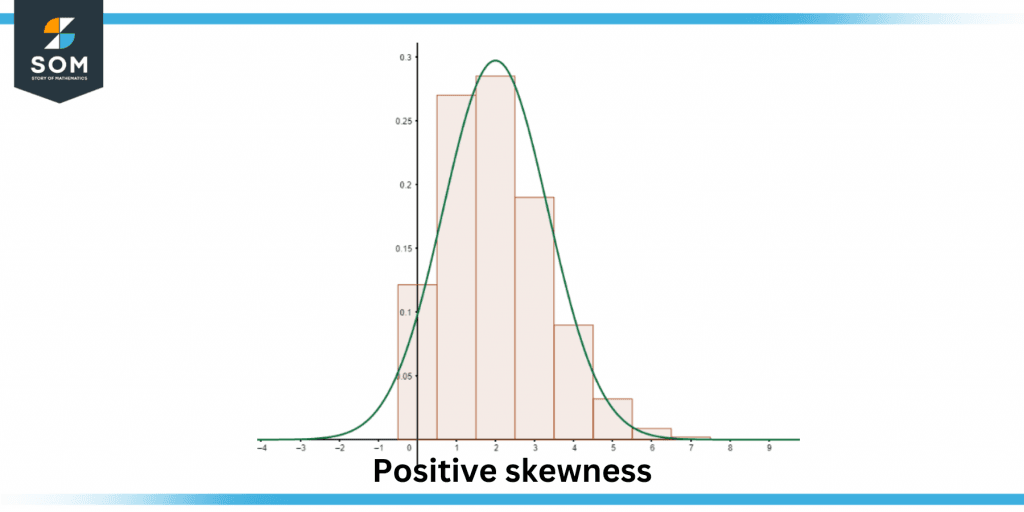
Figure 3 – Positive skewness
A bell curve that represents a normal distribution will have a skew value of zero, as opposed to having either a positive or negative for skew. Data that is almost symmetrical also contains a skew value that is close to zero.
Knowing skewed data is essential if you are a data scientist or, indeed, any type of professional who deals with data. This is because the majority of circumstances that occur in the real world are not symmetrical, and genuine data sets are typically skewed.
Skewed data can, however, be problematic for statistical models because outliers, which are frequently the root cause of skew, can have a detrimental effect on the performance of a statistical model. Because of this, it is essential to have a good understanding of skewed data, particularly how to compute it.
Examples of Data With a Skewed Distribution
The following are some instances from real life that should help you have a better understanding of both positive as well as negative skew:
Positive Skew
A typical income set of data is a good example of data that has a positive skew. On a graph, if you construct a curve that represents the income of a sample group, it is likely that the curve will be skewed to the right, also known as being positively skewed.
This will be the case if the majority of people have earnings that are about average and a smaller percentage of people have incomes that are above average. The individuals in the data set that have high earnings are the ones who are considered to be outliers, which causes the curve to be skewed forward towards the right side of the graph.
Negative Skew
The test results of a group of college students who were given a test that was not particularly difficult is an illustration of data that is skewed in an unfavorable direction. When shown on a graph, the curve that represents the distribution of the group of students’ test scores is likely to be skewed to the left.
In such a scenario, most students would have high test scores, while a smaller percentage of individuals would have low scores, which would cause the curve to be skewed toward the left side of the graph. The students who completed the test with the lowest scores were outliers within the data set, causing it to be skewed in an unfavorable direction.
How To Determine the Skewness
You can compute the skewness, also known as the amount of skew, in a data collection by following these four fundamental steps, which are as follows:
Find the Average, the Median Point, and the Standard Deviation
Finding the numbers for three features of your data is the first step in manually determining skew. These are the characteristics:
The average value of a given data collection is referred to as the mean in mathematics. A data set’s mean can be determined by first adding all of the values in the set together & then dividing that total by the total number of values in the data.
The value that corresponds to the point that is located exactly in the middle of all the data points is called the median. You can determine the median of a set of values by placing all of the values in your data set in ascending order, from the smallest to the largest, and then locating the value that is exactly in the middle of the set.
The standard deviation in terms of A statistical measurement known as the standard deviation is used to represent the variety of results or the degree to which the values are “spread out.”
When calculating standard deviation for a given set of data by hand, first determine the mean of each of the resulting values, then subtract each value of the dataset from the mean (these are called deviations), square each deviation, and sum them all. After that, divide by the total number of data instances.
At this point, you have the mean of the square deviations, which is called variance. Take the square root of this value, and you have the standard deviation.
Plug Into the Skew Formula
After you have determined the mean, median, & standard deviation for your data, you will be able to use the skew formula to determine the degree to which your data is skewed. To get a solution for the skew, you can solve the equation by entering each of your values:
Skewness of Data = 3 * (Mean – Median) / Standard Deviation
Make Sure by Using a Calculator
After completing the skew calculation, you can use a graphing calculator to verify your answer and validate that you obtained the correct result.
In addition, if you would rather not calculate skew by hand at all, you are free to do so and instead make use of a graphing calculator in its place. The SKEW function is what you want to use on a graphing calculator when calculating skew.
Transform the Skewed Data You Have
You also have the option of transforming your data from a skewed distribution to a normal distribution if this becomes necessary. You have the option, dependent on the data set you’re working with, to alter skewed data using such approaches.
The process of transforming a data set from a skewed distribution to a normal distribution by employing exponents is known as the exponential transformation. The application of functions to data during power transformation might help you stabilize it, which is made possible thanks to power transformation.
To get a data set closer to having a normal distribution, power transformation is a helpful technique. Log transformation is another common method that is utilized in the process of transforming data sets that are favorably skewed. Log transformation entails applying the natural log to each value in the data set.
A Numerical Example of Skew Data
Estimating the Median Skewness using Pearson’s Formula Pearson’s skewness of the annual median sunspot count is:
- The mean is 48.6.
- The median is 39.
- The standard deviation is 39.5.
Solution
Given that:
- Mean is 48.6
- Median is 39
- The standard deviation is 39.5
We know the formula:
Skewness = 3 x (Mean – Median) / Standard Deviation
By putting values in the above formula, we get:
Skewness = 3 x (48.6 – 39) / 39.5
= 3 x (9.6 / 39.5)
By simplifying, we get the following:
Skewness = 0.73
All mathematical drawings and images were created with GeoGebra.