JUMP TO TOPIC
What Is a Table?
In mathematics, a table is a way of organizing and displaying data in a structured format. It is a set of rows and columns that are used to represent information in a clear and concise manner. A table can be used to represent a wide range of mathematical concepts, including but not limited to: functions, sequences, and statistical data.
One of the most basic types of tables is a function table. A function table is used to represent the relationship between two variables. It contains two columns, one for the input values and one for the corresponding output values.
The input values are typically represented on the left-hand side of the table, while the output values are represented on the right-hand side. The input values are plugged into the function, and the corresponding output values are calculated and recorded in the table.
An example of a function table is the table that represents the function f(x) = 2x+3, where x is the input value and f(x) is the output value.
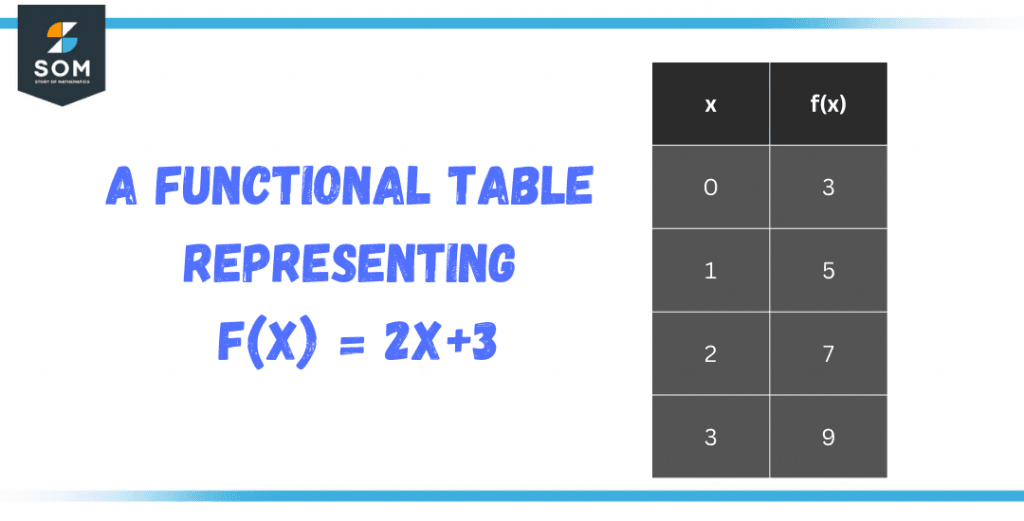
Figure 1 – A functional table representing f(x) = 2x+3
Another type of table is a sequence table. A sequence table is used to represent a sequence of numbers, such as the Fibonacci sequence or the prime numbers. It contains one column for the term number and another column for the corresponding term value.
The term number represents the position of the term in the sequence, and the term value represents the value of the term at that position. An example of a sequence table is the table that represents the Fibonacci sequence, where the first column represents the term number and the second column represents the term value.
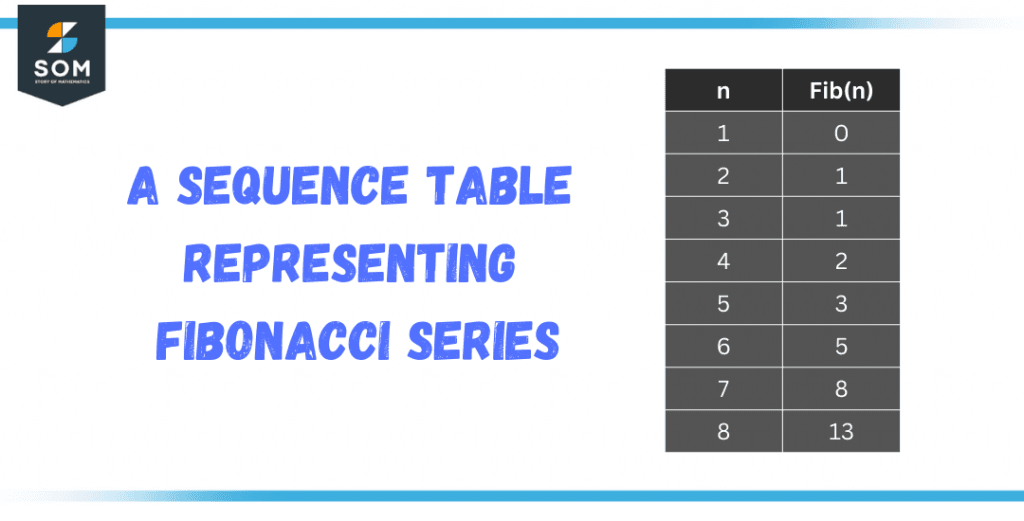
Figure 2 – A sequence table representing the Fibonacci series
A third type of table is a statistical table. A statistical table is used to represent statistical data, such as a frequency distribution or a cumulative frequency distribution. It contains a column for the data values and a column for the corresponding frequencies. The data values represent the different categories of data, while the frequencies represent the number of occurrences of each category.
An example of a statistical table is a table that represents the number of students in a class who scored a certain grade on a test, where the first column represents the grade and the second column represents the frequency of that grade.
In addition to these basic types of tables, there are many other types of tables that can be used in mathematics. For example, a multiplication table is used to represent the results of multiplication facts for a given number.
A probability table is used to represent the probability of different outcomes for a given event. And a truth table is used to represent the logical relationships between different statements.
Types of Tables
Multiplication Tables
A multiplication table, also known as a times table, is a table that lists the results of multiplying numbers by one another. It is a fundamental tool used in mathematics to help students learn and memorize the basic facts of multiplication.
Multiplication tables are typically arranged in a grid format with the multiplicand (the number being multiplied) listed on the top or left side of the table and the multiplier (the number used to multiply the multiplicand) listed on the bottom or right side of the table.
The use of multiplication tables can be traced back to ancient civilizations, such as the Egyptians and the Greeks, where they used multiplication tables to perform calculations in trade and commerce. In modern times, multiplication tables are widely used in elementary and middle school mathematics education as a way to help students learn and memorize the basic facts of multiplication.
Multiplication tables are also useful in real-life applications, such as in engineering, construction, and other fields that require calculations involving measurements and dimensions. Being able to quickly recall the multiplication facts allows for faster and more accurate calculations, which can save time and reduce errors.
Statistical Tables
Statistical tables are tables that are used to organize and display statistical data in a structured format. They are used to summarize and present large amounts of data in a way that is easy to understand and analyze.
Statistical tables typically contain rows and columns, with the rows representing individual observations or cases and the columns representing the variables or characteristics of those observations.
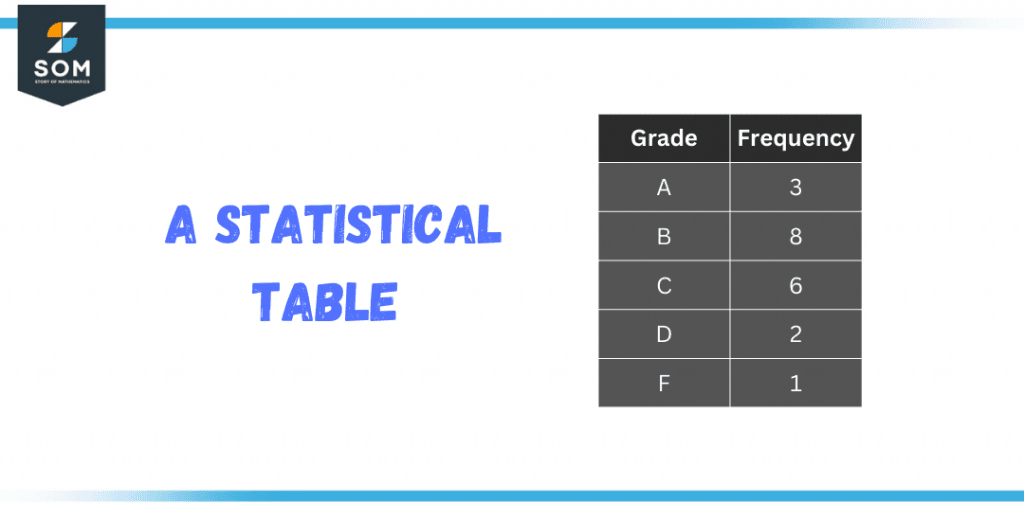
Figure 3 – A statistical table
Frequency distributions are tables that show the number of observations or cases that fall into different categories or classes. They typically contain two columns: one for the categories or classes and another for the frequencies of observations in each category.
For example, a frequency distribution table for the number of students in a class who scored a certain grade on a test would have the grade as the category and the frequency of that grade as the value.
Cumulative frequency distributions are similar to frequency distributions, but they also show the cumulative number of observations or cases that fall into different categories or classes. They typically contain three columns: one for the categories or classes, another for the frequencies of observations in each category, and a third for the cumulative frequencies of observations.
Truth Tables
Truth tables are a way of representing the logical relationships between statements in a clear and concise manner. They are used in propositional logic, which is a branch of mathematical logic that deals with statements that can either be true or false.
A truth table is a table that lists all possible combinations of logical statements and their resulting truth values. Each row of the table represents a different combination of input statements, and the corresponding truth value for that combination is given in the final column of the table.
Truth tables have one column for each statement or logical operator being considered and one final column for the resulting truth value of the entire logical expression.
The number of rows in a truth table is determined by the number of statements or logical operators being considered; each statement or operator has two possible values (true or false), so the number of rows is 2 raised to the power of the number of statements or operators.
For example, the truth table for the logical statement “A and B” would have two columns (one for A and one for B) and one final column for the resulting truth value of the statement “A and B.”
The table would have four rows, one for each possible combination of values for A and B (A=T, B=T), (A=T, B=F), (A=F, B=T), (A=F, B=F). The resulting truth value for each row would be true if A and B are both true and false otherwise.
Solved Example Involving Functional Tables
Consider the function f(x) = 2x$^3$ + 5x$^2$ – 3x + 7. Create a functional table that lists the input values of x from -2 to 2, with increments of 0.5, and the corresponding output values of f(x).
Also, use the functional table to determine the local maximum and minimum points of the function and the inflection points if they exist.
Solution
To determine the local maximum and minimum points of the function, we can look for the points where the first derivative of the function is equal to zero. To find the inflection points, we can look for the points where the second derivative of the function is equal to zero.
- First Derivative: f'(x) = 6x$^2$ + 10x – 3 = 0
- Second Derivative: f”(x) = 12x + 10 = 0
Solving the first derivative for x, we get x = -1/2 and x = -1/3, which correspond to the local minimum and inflection points. Solving the second derivative for x, we get x = -5/2, which corresponds to the local maximum point.
Therefore, the local maximum point is at x = -5/2, the local minimum point is at x = -1/2, and the inflection point is at x = -1/3.
This problem uses functional tables to represent the function and its output values, the use of derivatives to find the maximum, minimum, and inflection points, and the solving of equations to find the x values at which the points occur.
All images are created using GeoGebra.