JUMP TO TOPIC
The sole variable in univariate data is the one being studied. Since the information only focuses on one variable at a time, the study of univariate data is the most straightforward method of data analysis. The analysis focuses mostly on describing the data and locating any patterns that may be present within it; it does not investigate the factors or connections that led to the observed results. for example the height of individuals shown below:
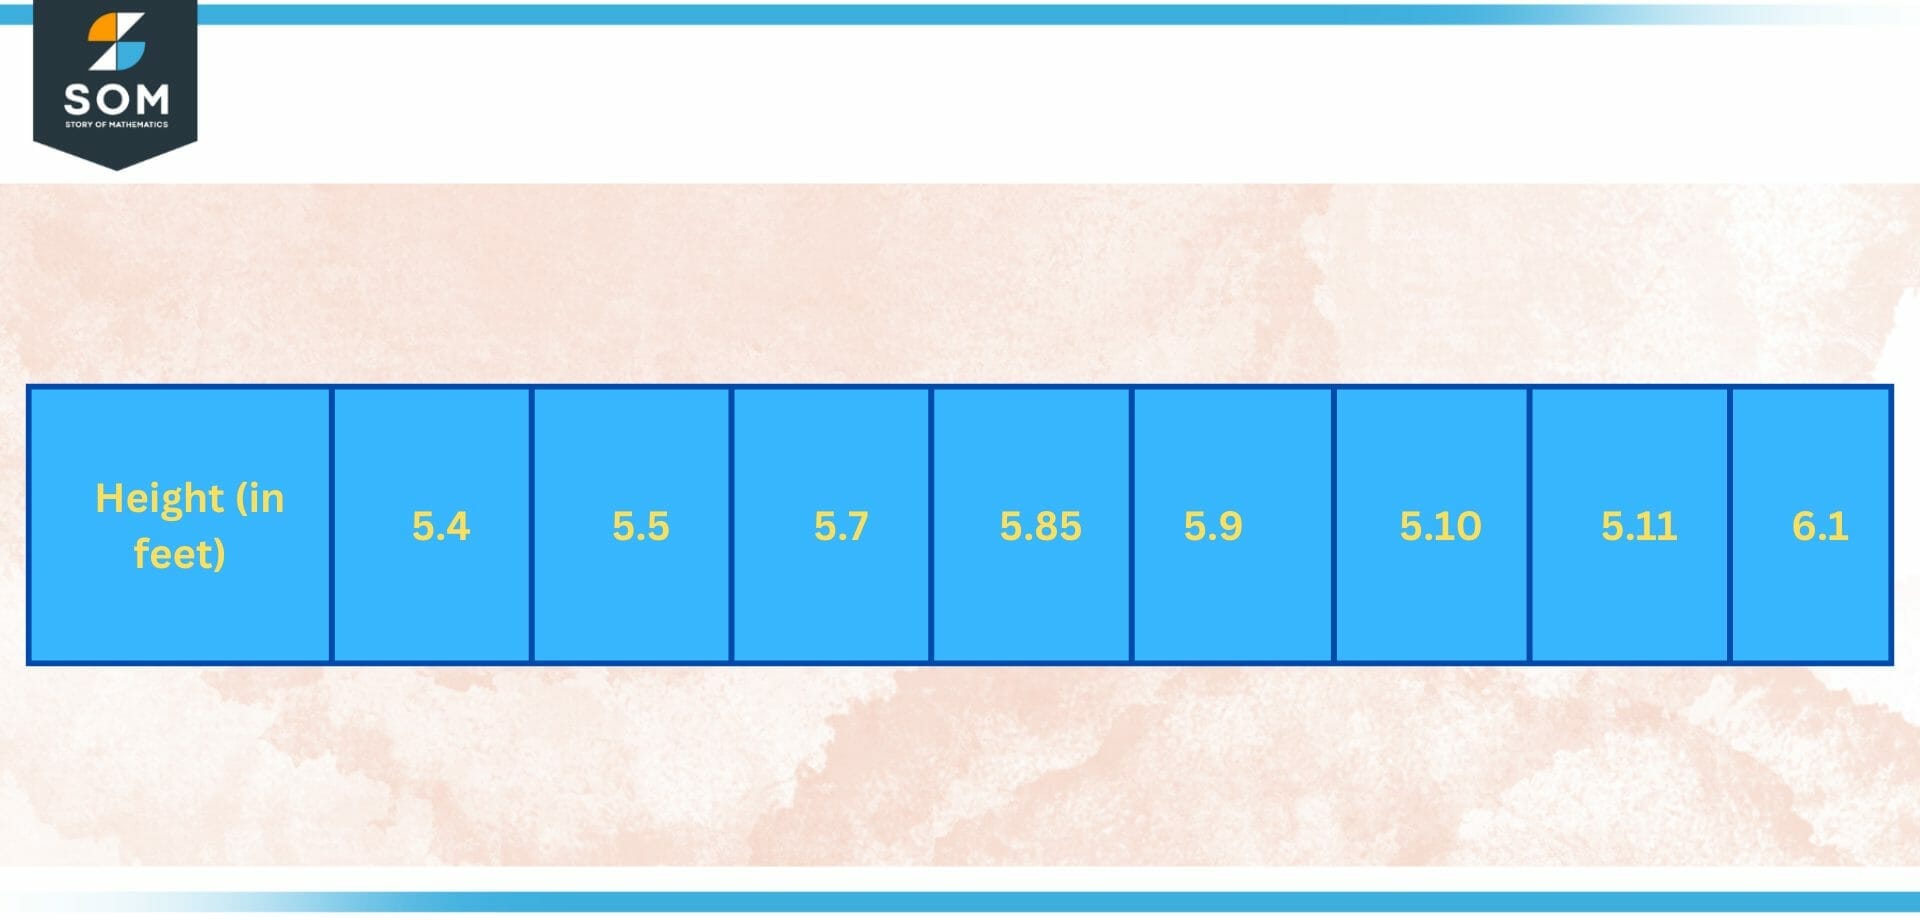
Figure 1 – Univariate data of Height (in feet)
A proprietor of a food stand who is interested in learning more about their business compiles a list of sales by tallying the number of hot dogs that are purchased over a specified amount of time and compiling the data. Because there is only one variable in this data, which is the total number of hot dog sales, we shall refer to it as univariate data.
If the same individual wanted to determine which days are more successful for selling hot dogs, they would first have to compile a list of the days of the week and the total amount of sales for each day. The data will now be presented as bivariate data, with the number of hot dog sales serving as one of the variables and the number of days serving as the second variable.
While the analysis of the bivariate data would reveal information about whether or not there is a relation between sales of hot dogs and days of the week, the analysis of the univariate data would reveal information about sales of hot dogs regardless of whether or not there is a relation between sales of hot dogs and days of the week.
Types of Univariate Data
Categorical Univariate Data
The categorical univariate data contains non-numerical observations that can be sorted into the appropriate categories. It contains labels or names that are utilized for the purpose of identifying an attribute of each element. Typically, a nominal or ordinal scale of measurement is utilised when dealing with categorical univariate data.
Numerical Univariate Data
Observations in numerical univariate data are characterized by their numerical format. They can be obtained by the utilization of ratio or interval scales of measurement. Two additional subcategories can be applied to this sort of univariate data: discrete and continuous.
The set of all potential values for numerical univariate data is considered to be discrete if it is finite or countably infinite. Counting is the most common type of analysis performed on discrete, univariate data (such as the number of books read by a person).
Continuous data for a numerical univariate variable are those in which the set of all possible values is represented by a number or number range. The term “measurement” is almost always connected with continuous univariate data (such as the weights of people).
Here are some examples of univariate data. The non-numerical characteristics, such as a person’s preferred animal, the highest level of schooling attained, or the color of their home, are examples of categorical data.
The collection of things that can be counted is known as numerical data. Some examples of numerical data are the salaries of employees, sales on a specific product, and the heights of people.
Even though univariate data can be represented in the form of lists, more popular representations of this type of data include frequency tables, charts, and graphs. Take a look at these 8 students’ math scores: 80, 52, 64, 71, 52, 85, 88, and 90.
This univariate data consists of numerical data and might be expressed in the frequency table, which can be found below. As there are two 52s, its frequency is two, whereas the frequency of all the other scores is one.
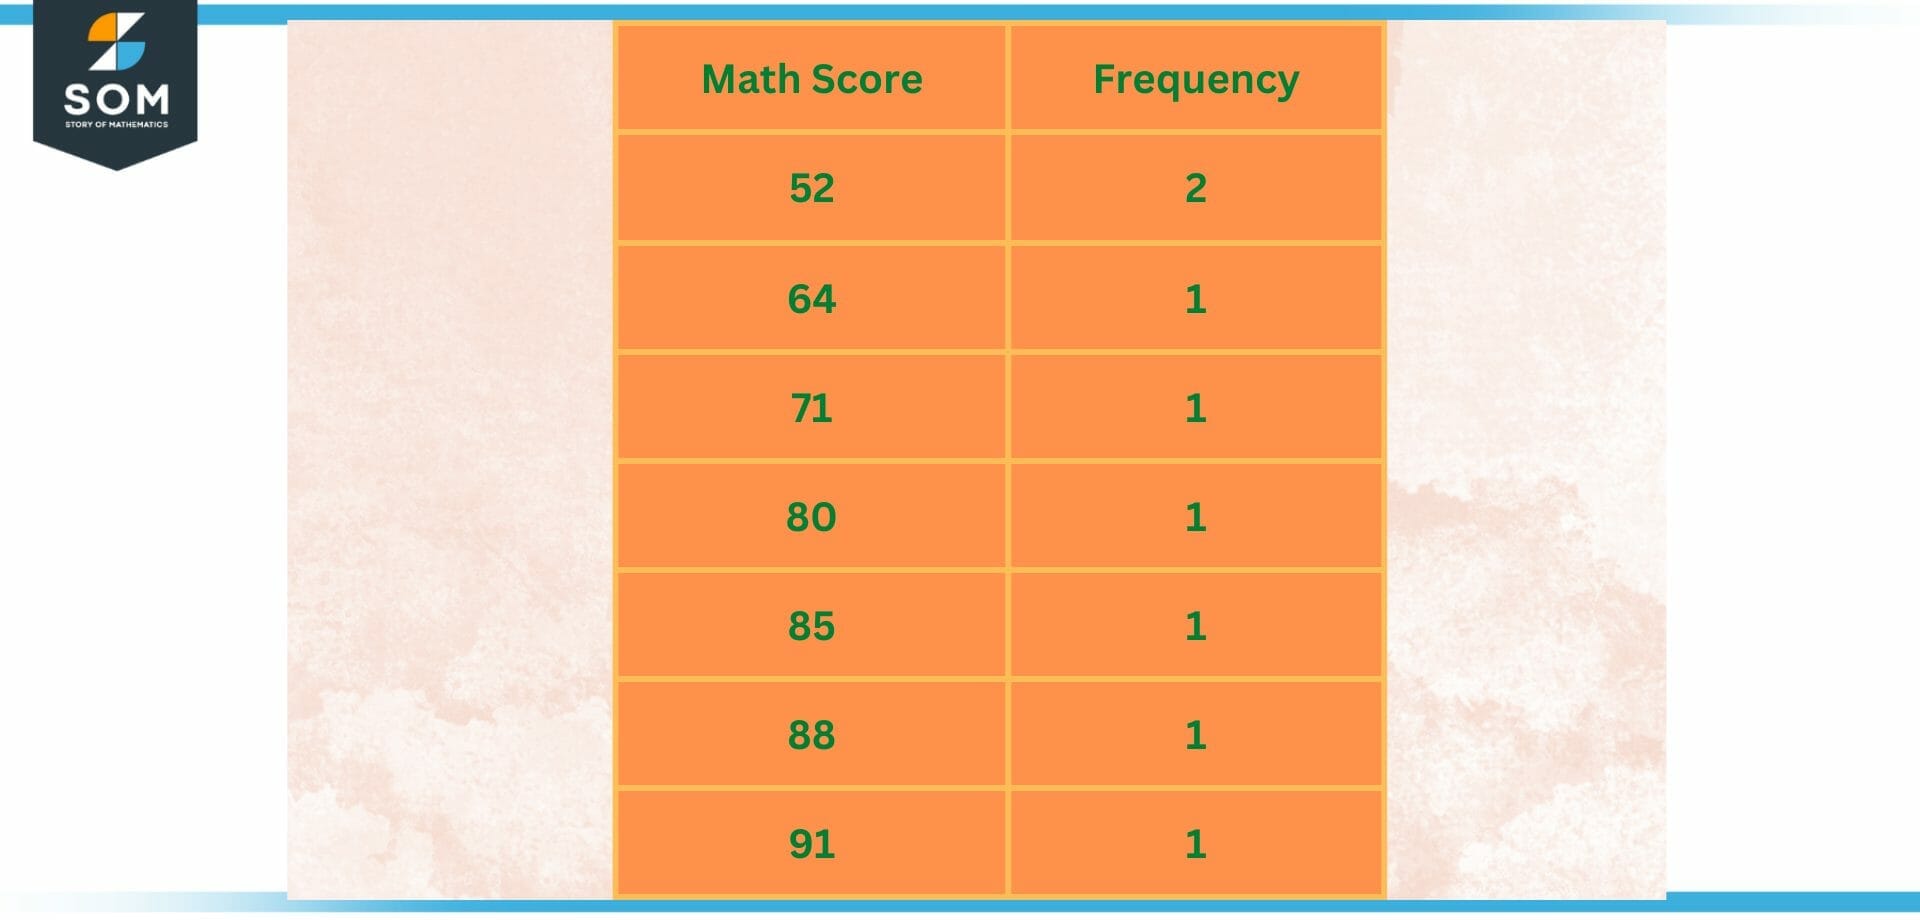
Figure 2 – Univariate Frequency table
Daily Life Examples of Univariate Data
Examples of univariate data include things like the incomes of workers in a company, the number of pets that live in various houses, the length of trout that live in a lake, the heights of students who are in a given age group, and so on. Each of the variables on its own constitutes univariate data.
This is true even in the case of bivariate data, such as the salary of employees and the number of years they have spent working for the company.
Difference Between Univariate Data and Bivariate Data
A univariate analysis focuses on a single variable, whereas a bivariate analysis looks at two variables simultaneously.
The following is a list of the differences that can be found between univariate data and bivariate data:
Univariate data:
- Involves a single variable
- Does not address relationships or the causes of events.
- The major objective is to describe.
- An example question: approximately how many of the class’s participants are male?
Bivariate data:
- Requires the use of two separate variables.
- Discusses effects and connections between them.
- The most important goal is to explain.
- Example: A hypothetical inquiry: is there a connection between the proportion of young men who participate in computer programming and the grades they receive in mathematics?
Therefore, the fundamental distinction between univariate data and bivariate data is that the former only describes a single variable inside it, whilst the latter investigates the relationship and causes.
Univariate Analysis
Variate denotes a variable, and “uni” signifies “one.” Because there is just one variable involved in univariate analysis, this type of study is known as univariate analysis. In the real world, conducting an analysis of a dataset using only one variable (or column) at a time is an example of a univariate analysis (data table).
Univariate analysis, which is one of the many types of analytical methodologies that data analysts put into effect, is considered to be one of the most fundamental forms of analysis. In most cases, it is the first stage in the process of comprehending a dataset. The objective of a univariate analysis is to gain an initial comprehension of each variable on its own. After that, you move on to simultaneously analyzing two or more variables, if not more.
Steps to follow when carrying out a univariate analysis
The following is a rundown of the four phases involved in conducting univariate analysis:
- Accessing a dataset that is of interest.
- Recognizing the variable of the problem that requires analysis.
- Recognizing the questions that should be answered by means of the analysis.
- Determining the type of univariate analytic approaches that are most suitable for providing answers to the questions that have been identified previously
Statistics-based programming languages such as SPSS, SAS, and R are commonly utilized in the deployment of several forms of univariate approaches. Python is one of the most common languages used in data science and analytics, and this task can also be accomplished using other languages.
Spreadsheet software such as Microsoft Excel is typically utilized for conducting fundamental univariate analyses on restricted data sets. However, before you begin using any of these tools, you need to have a solid understanding of the fundamental principles behind what constitutes a dataset, specifically the different kinds of columns that make up a dataset.
This is very important information to have, as different methods of univariate analysis are utilized depending on the type of the variable being analyzed.
Univariate Tables
Tables are a useful tool for univariate analysis and are most commonly utilized with data that is categorical or numerical but has a restricted cardinality. The following are some types of tables:
- Frequency Tables: A table is used to display each distinct value and the frequency with which it appears in the data. Therefore, it provides a summary of the frequency in a manner comparable to that of a histogram, frequency bar chart, or pie chart but in a tabular format.
- Grouped Tables: Tables Arranged in Groups Instead of finding the count of each distinct value, the values are binned or aggregated, and the table reflects the frequency of each bin or group. In most cases, it is utilised for numerical data that possesses a high cardinality.
- Percentage (Proportion) Tables: Tables that Display Proportions or Percentages Instead of displaying the Frequency of the Unique Values (or Groups), this type of table displays the Proportion of the Unique Values or Groups in the Data (in percentage).
- Cumulative Proportion Tables: This chart is quite similar to the proportion table; however, the proportions are shown in a cumulative fashion rather than in a linear fashion. Binned data in a specific order is the typical application for this technique (or with categorical, ordinal data).
All of these univariate tables can, in certain circumstances, be utilized as an alternative to a method of expressing the study that relies more heavily on graphs.
Examples of Univariate Data Problems
Example 1
How do you examine univariate data?
Solution
There are numerous perspectives to take when describing data. This involves the creation and use of graphs, tables, descriptive statistics, and hypothesis tests, as well as the use of statistical or programming languages for spreadsheets and other statistical analysis.
Example 2
Consider that the individuals in a class have the following weights in kilograms : 50, 58, 65, 70, 74, 79, and 81. We only have weights available to us as a single variable, making our situation univariate. represent it as a univariate data in a table.
Solution
The data of class student weights in kilograms is given as : 50, 58, 65, 70, 74, 79, and 81. as we can observe the data looks like univariate that can be represented in table as below:

Figure 3 – Univariate data of Weight (in kg)
All images/mathematical drawings were created with GeoGebra.