JUMP TO TOPIC
Inverse Trig Graphs – Explanation and Examples
Inverse trig graphs are the graphical representations of the arcsine, arccosine, arctangent, arccosecant, arcsecant, and arctangent.
Technically, these are not actually functions except over certain intervals.
Inverse trig graphs are helpful as a visual and can be useful in all circumstances where inverse trigonometry is used, including engineering and physical science.
To get the most out of this article, read up on inverse trig functions first.
How To Graph Inverse Trig Functions
To graph an inverse trig function, it helps to understand a little bit more about them. Graphing inverse trig functions is more difficult than graphing regular trig functions. This is because, technically speaking, inverse trig functions are not actually functions at all.
Recall that a function has a unique output for every input. But the role of arcsine, arccosine, arctan, arccosecant, arcsecant, and arccotangent is to take a ratio and say at which angles the corresponding trig function achieves that ratio. Since all of these functions are periodic and infinitely repeat themselves, there are infinitely many angles at which the trig functions achieve all of the ratios in their respective ranges.
Therefore, inverse trig operations are only functions when small segments of the graph are considered. Even one period of the trig function may not work because the function may repeat values over that interval. For example, sine is equal to $0$ at $0$ and $\pi$ in the interval $[0, 2\pi)$. Therefore, arcsine would have two different outputs for an input of $0$, even over that short range.
Range Restriction with Inverse Trig Functions
Range restriction is necessary when graphing inverse trig functions. This is because trig functions are periodic. Therefore, there are infinitely many angles at which the function achieves a given ratio. Thus, the inverse would have multiple y-values for each x-value, meaning it would not be a function.
Range restriction solves this problem by only considering the inverse of the trig function over a range where the y-values do not repeat themselves. The restricted range must correspond to an interval of the domain of the respective trig function where the function is only increasing or only decreasing. That is, the range is an interval where the function does not change direction.
Inverse Cosine Graph
The inverse cosine graph has a domain of $[-1, 1]$. If its range is restricted to $[0, \pi]$ radians, then it is a function. This is because the cosine function decreases from $1$ to $-1$ from $(0, \pi)$.
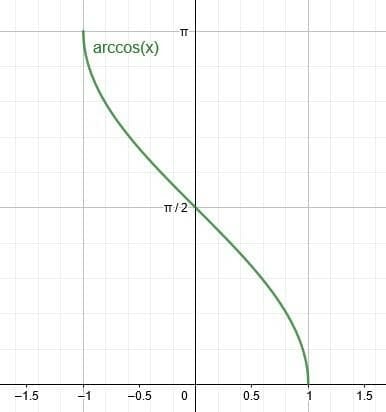
This segment of the arccosine graph looks like the corresponding cosine function segment but is reflected over the line $y=x$. This is because the inverse of any function is the original function reflected over the line $y=x$.
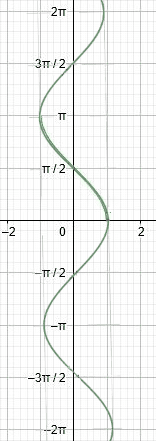
Therefore, continuing this graph (which makes it no longer a function) creates a wave that moves vertically instead of horizontally.
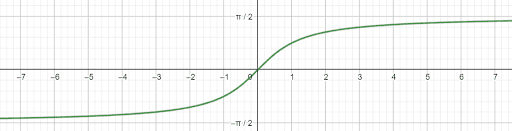
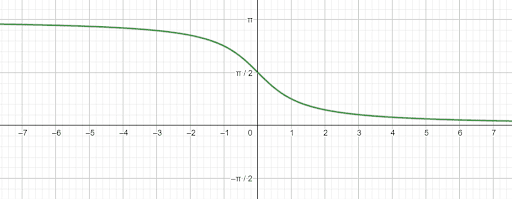
Inverse Tan Graph
The inverse tan graph has a domain of $(-\inf, \inf)$. If its range is restricted to $(-\frac{\pi}{2}, \frac{\pi}{2})$, it is also a function.
Like other inverse functions, the arctan graph looks like the graph of the tangent function reflected over the line $y=x$. It is always increasing and has two horizontal asymptotes. As $x$ gets infinitely small, the graph goes to $-\frac{\pi}{2}$. As $x$ gets infinitely large, the graph goes to $\frac{\pi}{2}$.
Inverse Sine Graph
The inverse sine graph looks a lot like the inverse cosine graph. This makes sense since their base graphs also look a lot alike. The main difference is the y-intercept of the graph.
Like arccosine, the graph of arcsine has a domain of $[-1, 1]$ and, when restricted to a range of length $\pi$ such as $[-\frac{\pi}{2}, \frac{\pi}{2})$, it is also a function.
Other Inverse Trig Graphs
Other inverse trig functions, namely arccosecant, arcsecant, and arccotangent, are only functions over restricted ranges too. The restricted ranges for arccosecant and arcsecant are $[-\frac{\pi}{2}, \frac{\pi}{2}]$ and $[0, \pi]$, respectively. For arccotangent, the restricted range is $(0, \pi)$.
Arccotangent will have all real numbers as its domain. Arccosecant and arcsecant will have domains of all real numbers except those in the interval $(-1, 1)$.
Examples
This section goes over common examples of problems involving inverse trig graphs and their step-by-step solutions.
Example 1
Is the inverse sine graph a function over the interval $[\pi, 2\pi]$? Why or why not?
Solution
The inverse sine graph will be a function when the range of the graph is restricted to an interval where sine is only increasing or only decreasing. This is because if the original graph changes direction, the inverse graph will double back on itself to the left or the right. Thus, one or more x-values would have multiple corresponding y-values.
Thus, it is required to determine whether sine is increasing or decreasing on the interval $[\pi, 2\pi]$. From $(\pi, \frac{3\pi}{2})$, the sine function decreases. Then, it increases over the interval $(\frac{3\pi}{2}, 2\pi)$.
Therefore, the inverse sine graph is not a function over the interval $[\pi, 2\pi]$.
Example 2
What does the graph of the inverse cotangent look like?
Solution
The graph of the inverse cotangent will look similar to the graph of the inverse tangent because the graphs of tangent and cotangent look similar. These two graphs will have different y-intercepts, however. The inverse cotangent will also be decreasing because the inverse tangent graph is increasing.
To graph this function, flip the cotangent function over the line $y=x$. Its y-intercept will be $\frac{\pi}{2}$, and it will have a domain of $(-\inf, \inf)$.
Like tangent, cotangent has a period of $\pi$ over which it decreases the whole time. Therefore, the inverse cotangent should be restricted to a range of length $\pi$ over which the cotangent consistently decreases.
One such range is $(0, \pi)$. As the x-values of the inverse cotangent get infinitely smaller, the y-values of the inverse cotangent get infinitely closer to $\pi$. As the x-values of the inverse cotangent get infinitely larger, the y-values will get infinitely closer to $0$.
Thus, the graph will look like this.
Example 3
Graph $arccos(2x)-\frac{\pi}{2}$. Restrict the range if necessary so that the graph is a function.
Solution
Assume the starting range of $[0, \pi]$. Subtracting $\frac{\pi}{2}$ from the function moves the graph downwards by $\frac{\pi}{2}$ units. Therefore, the function will have a new range of $[-\frac{\pi}{2}, \frac{\pi}{2}]$.
The new graph also has a coefficient of $2$ in front of the variable. This has the same effect as putting the inverse of $2$ (\frac{1}{2}) in front of the cosine function. That is, it restricts the domain of the function.
Instead of having a domain of length $2$, this function’s new domain will have a length of $\frac{2}{2} = 1$. It will still, however, be centered at $0$. Thus, the new domain will be $[-\frac{1}{2}, \frac{1}{2}]$.
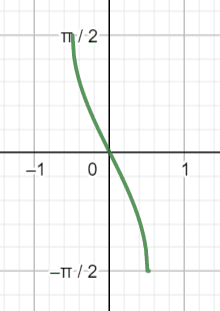
Example 4
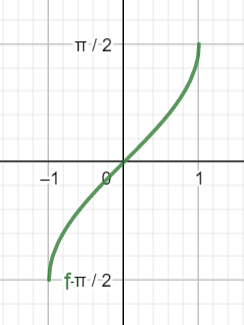
Identify the inverse trig function graphed below.
Solution
This function has the same basic shape as the sine function since it is increasing. It has been shifted one unit to the right, and it has also been compressed.
Since the range of this function is $[-\frac{\pi}{4}, \frac{\pi}{4}]$, its range is half of the base arcsine function. Therefore, the coefficient of the arcsine function is $\frac{1}{2}$.
Then, since the function has moved one unit to the right, the variable will have a horizontal shift of $-1$.
These are the only two changes from the base function, so the equation for the trig function is $\frac{1}{2}arcsin(x-1)$, restricted to the range $[-\frac{\pi}{4}, \frac{\pi}{4}]$.
Example 5
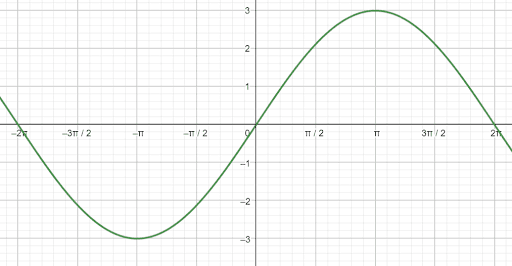
Graph the inverse of $3sin(\frac{1}{2}x)$.
Solution
Since there is a coefficient of $3$ in front of the function, it has an amplitude of $3$. Then, since there is a coefficient of $\frac{1}{2}$ in front of the variable, the period of the function increases from $2\pi$ to $\frac{2\pi}{\fra{1}{2}} = 4\pi$.
Thus, the function $3sin(\frac{1}{2}x)$ will look like this:
Now the inverse of this function will be this function reflected over the line $y=x$ with a restricted range.
In this case, since the original function has a longer domain over which it continually increases, the inverse function will have a larger range. Specifically, the function increases from $[-\pi, \pi]$, so this is the restricted range of the function.
Then, since the amplitude is larger, the width of the inverse graph will increase. Instead of having a domain from $[-1. 1]$, the new domain will be $[-3, 3]$.
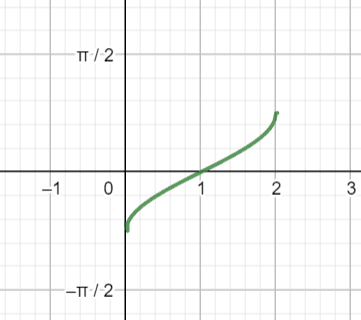
Finally, the inverse function will look like this.
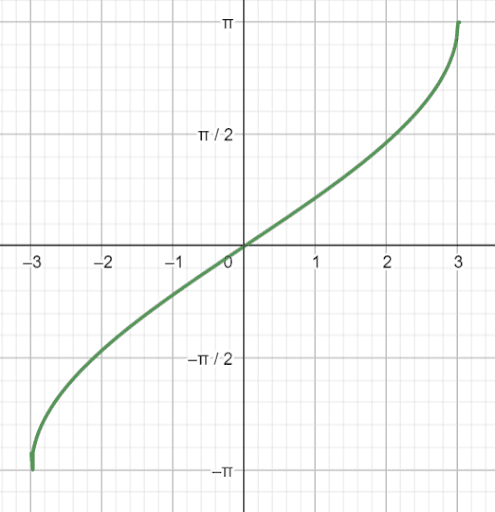
This is the graph of the function $2arcsin(\frac{1}{3}x).
Practice Questions
Images/mathematical drawings are created using Geogebra.