JUMP TO TOPIC
Constrained Optimization Calculator + Online Solver With Free Steps
A Constrained Optimization Calculator is a helpful tool to get extreme values of a function inside the specified region in a few seconds, which is a tedious task.
The function solution is expressed in the form of global minimum, global maximum, local minimum, and local maximum.

What Is a Constrained Optimization Calculator?
A Constrained Optimization Calculator is a calculator that finds out the minimum and maximum values of a function within a bounded region, which is defined by constraints on the variables of the function.
Optimization means finding out the maximum and minimum values of a function. It is easy to calculate these values by evaluating the 1st and 2nd derivative tests of the function.
To calculate the derivative of a complex function with a higher degree of the polynomial and bounded inside a particular region, this is the calculator that can save your time by solving it quickly.
It not only returns local maximum and minimum but also the global ones that are important for many applications.
To use this tool, you need a function that is an objective function and constraint in the form of an equation in the area where you want to find its optimal values. You can enter these functions in their respective boxes.
How To Use Constrained Optimization Calculator?
You can use the Constrained Optimization Calculator by entering the desired objective functions and constraints of the function, and you will obtain the results in just a few seconds.
It is an easy-to-use online tool. Once you have all the requirements available, you can explore them by following the steps mentioned below.
Step 1
Use the calculator to calculate the extreme values of the desired function.
Step 2
Provide the target function in the Objective Function box. It can be any higher degree polynomial or any complex function like exponential etc.
It can take only one objective function at a time. It is the function whose optimal values you want to find out.
Step 3
Now you may enter the constraints equation and hidden constraints in the S.T. constraint box. These are the equations that define restricted boundaries where we want to optimize our objective function.
The equation is a combination of variables, whereas hidden constraints are individual inequalities for each variable.
Step 4
For the last step, click on the Optimize button and it will display the entire solution starting from global minimum and maximum, then local minimum and maximum. These four points are shown in the form of cartesian coordinates. Then the 3D and contour plots for better understanding are also given by the calculator.
Solved Examples
Here are the examples solved using the Constrained Optimization Calculator.
Example 1
Consider the following objective function:
\[ e^{-0.5(x^2+y^2)} \]
The constraints for this function is given as:
x + y=0.5
x>0
y>0
Find the Global maxima, Global minima, Local maxima, and minima for the given function.
Solution
Input the function in the calculator.
The following results are obtained:
Global maxima:
\[ max \{e^{-0.5(x^2+y^2)} | x+y = 0.5 \wedge x>0 \wedge y>0 \} \approx 0.939413 \]
at,
(x,y) = (0.25,0.25)
Global minima:
\[min \{e^{-0.5(x^2+y^2)} | x+y = 0.5 \wedge x>0 \wedge y>0 \} \approx 0.882497 \]
at,
(x,y) = (0.5,0)
Local maxima:
\[ max \{e^{-0.5(x^2+y^2)} | x+y = 0.5 \wedge x>0 \wedge y>0 \} \approx 0.939413 \]
at,
(x,y) = (0.25,0.25)
3D Plot:
A 3D plot is shown below in Figure 1:
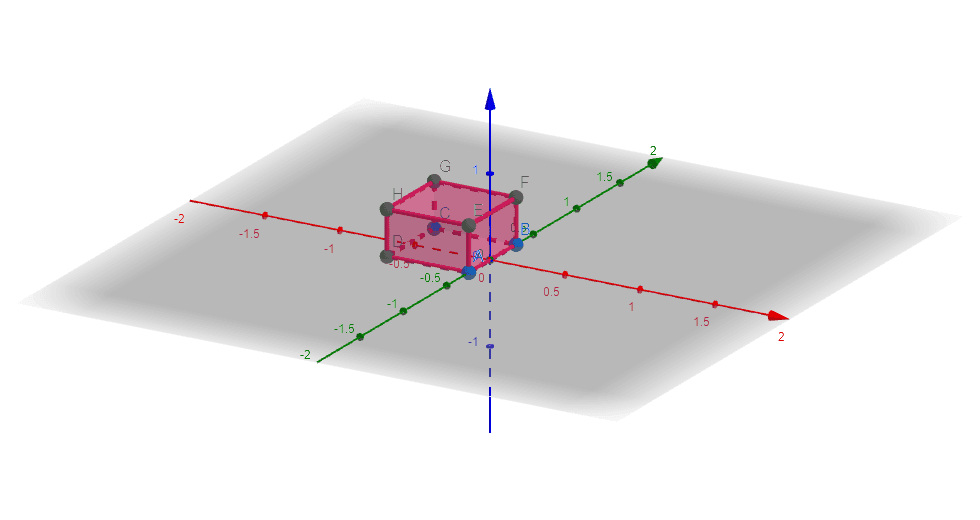
Figure 1
Contour Plot:
A contour plot for the given function is shown below in Figure 2:
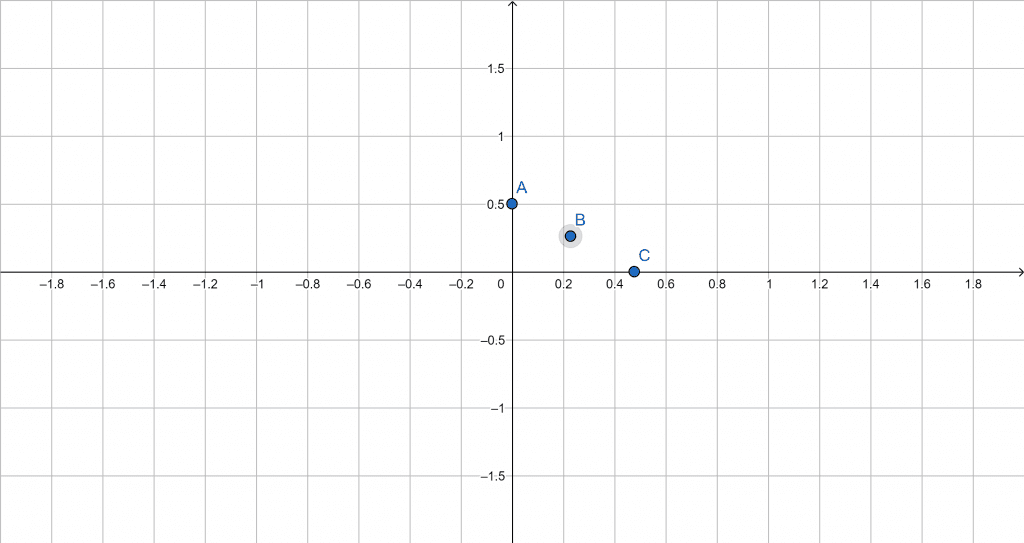
Figure 2
Example 2
Consider the objective function mentioned below:
f(x) = xy
The constraints for this function are as follows:
2x+2y = 20
Find the Global and Local maxima and minima for the above function.
Solution
Inserting the function in the calculator gives the following results:
Global Maximum:
max {xy | 2x+2y = 20|} = 25
at,
(x,y) = (5,5)
Local Maximum:
min {xy | 2x+2y |= 20 \} $\approx$ 25
at,
(x,y) = (5,5)
3D Plot:
The 3D Plot for this function is given below:
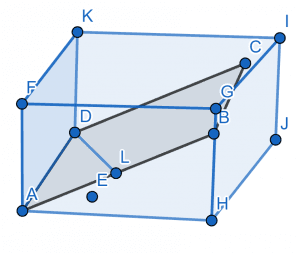
Figure 3
Contour Plot:
The contour plot is shown in Figure 4:
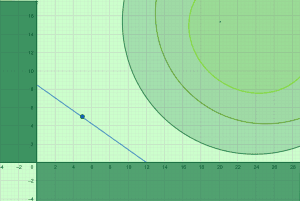
Figure 4
All the Images/Graphs are created using GeoGebra.