JUMP TO TOPIC
Equilibrium Point Calculator + Online Solver With Free Steps
The online Equilibrium Point Calculator helps you quickly calculate the equilibrium point of the defined curves.
The Equilibrium Point Calculator is a powerful tool for mathematicians and economists to find where the supply and demand curves intersect. The Equilibrium Point Calculator can be used to determine the consumer and producer surplus and equilibrium point.

What Is an Equilibrium Point Calculator?
The Equilibrium Point Calculator is an online tool that is used to calculate the equilibrium point intersecting the demand and supply curves.
The calculator requires two inputs, the demand equation, and the supply equation. The calculator then plots and calculates the intersection between the equations. The equilibrium point is where the consumers and producers are satisfied with the product’s price.
How To Use the Equilibrium Point Calculator?
You can use the Equilibrium Point Calculator by simply entering your mathematical equations in their respective boxes and clicking the “Submit” button. The results will generate instantly. The step-by-step process of using the Equilibrium Point Calculator is given below.
Step 1
First, you need to input your supply equation in the first box.
Step 2
After adding the first equation, input your demand equation into the second box.
Step 3
After adding both equations, click the Submit button. A new window will show the plotted graphs for your equations.
How Does an Equilibrium Point Calculator Work?
An Equilibrium Point Calculator works by calculating the equilibrium point or static point of demand and supply curves defined by the user. The curves are then plotted into a graph. The intersection between these two curves is called an equilibrium point. Economists use this to find information like consumer surplus and producer surplus.
What Is Equilibrium?
Equilibrium is a condition in which market supply and demand are balanced, resulting in steady prices. In general, prices fall when there is an oversupply of goods or services, resulting in increased demand, while a scarcity or undersupply leads costs to rise, resulting in a lower order.
Why Is Equilibrium Useful?
Equilibrium is useful because it leads to achieving both a balanced and efficient market. If the market is not at equilibrium, several economic pressures are applied to shift the price to a balance.
This occurs when there is either more supply than the market demands or when there is more demand than the market can supply.
A competitive market operating in equilibrium is considered efficient. When one group’s condition cannot be improved without inflicting a cost on another, this is called efficiency as defined by economists.
Demand Curve
The demand curve depicts the number of units of a service or product purchased at various price points. It represents the quantity-price connection that is calculated using the demand schedule. The prices are labeled on the vertical axis, while the quantity supplied is represented on the graph’s vertical axis.
A demand curve is usually always downslope, indicating consumers are eager to buy more of an item at reduced costs.
Supply Curve
The supply curve depicts the relationship between the cost of a commodity or service and the amount delivered over time. The price will often display on the left vertical axis, while the quantity supplied will appear on the horizontal axis in a typical diagram.
The supply curve is upward sloping. This shows the desire of the producers to sell more and more of their products at a higher price.
What Is an Equilibrium Point?
The point where the supply curve and demand curve intersect is called the equilibrium point. When two lines intersect on a graph, it usually means something.
As both the demand and supply curves have a price on the vertical axis and quantity on the horizontal axis, it is possible to plot them into a single graph. Demand and supply work together to determine the price and amount of goods bought and sold in a market.
The equilibrium point determines the equilibrium price of the graph. The equilibrium price is the only price where the producers and consumers are satisfied with the cost of the goods.
If the price is below the equilibrium point, the demand for goods will exceed the supplied quantity. This will cause a shortage of goods. If the cost exceeds the equilibrium point, this would indicate a surplus or excess of goods in the market.
Solved Examples
Here are some examples of finding the equilibrium point using the Equilibrium Point Calculator.
Example 1
Find the equilibrium point of the following curves.
The demand curve equation:
Qd = 100 – 5P
The supply curve equation:
Qs = -125 + 20P
Solution
First, we input the demand curve equation into the Equilibrium Point Calculator.
Qd = 100 – 5P
Then, we input the supply curve equation into the Equilibrium Point Calculator.
Qs = -125 + 20P
We click the submit button and the intersection point between the two curves is given, along with a graph, as shown in Figure 1 below:
P = 9 and y = 55
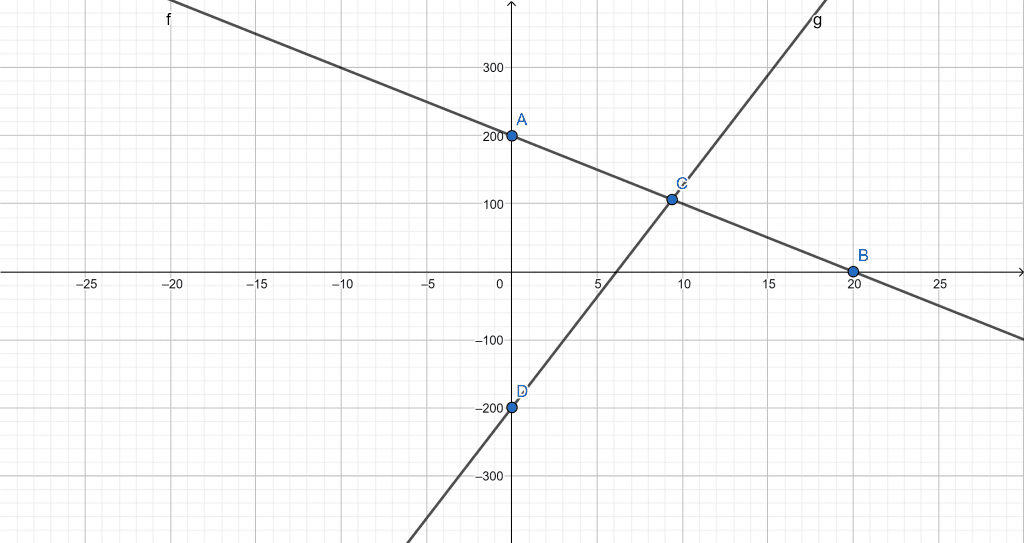
Figure 1
Example 2
Consider the following equations:
The demand curve equation:
Qd = 16 – 2P
The supply curve equation:
Qs = 2 + 5P
Using these curve equations for supply and demand, calculate the equilibrium point.
Solution
In the Equilibrium Point Calculator, we first add the demand curve equation:
Qd = 16 – 2P
After that, we type in the supply curve equation into our Equilibrium Point Calculator:
Qs = 2 + 5P
Clicking the submit button will instantaneously give us the equilibrium point of the curves and plot the graph, as shown in Figure 2:
P = 2 and y = 12
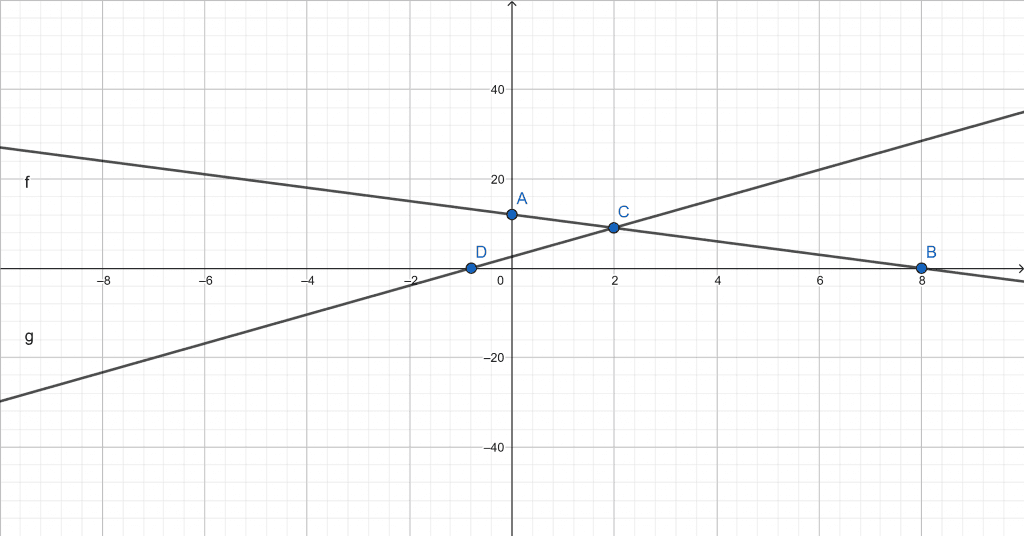
Figure 2
Example 3
Find the equilibrium point between these curves using the following equations for supply and demand curves.
Equation of demand curve:
\[ Q_{d} = (x – 4)^2 \]
Equation of supply curve:
\[ Q_{s} = x^2 + 8 \]
Solution
To solve these curve equations, we plug them into the Equilibrium Point Calculator. First, we add the demand curve equation:
\[ Q_{d} = (x – 4)^2 \]
Next, we plug in the supply curve equation:
\[ Q_{s} = x^2 + 8 \]
After plugging in both the equations, we click the “Submit” button. Immediately, we are given the equilibrium point of the curves, which is depicted in a graph as shown in Figure 3 below:
P = 1 and y = 9
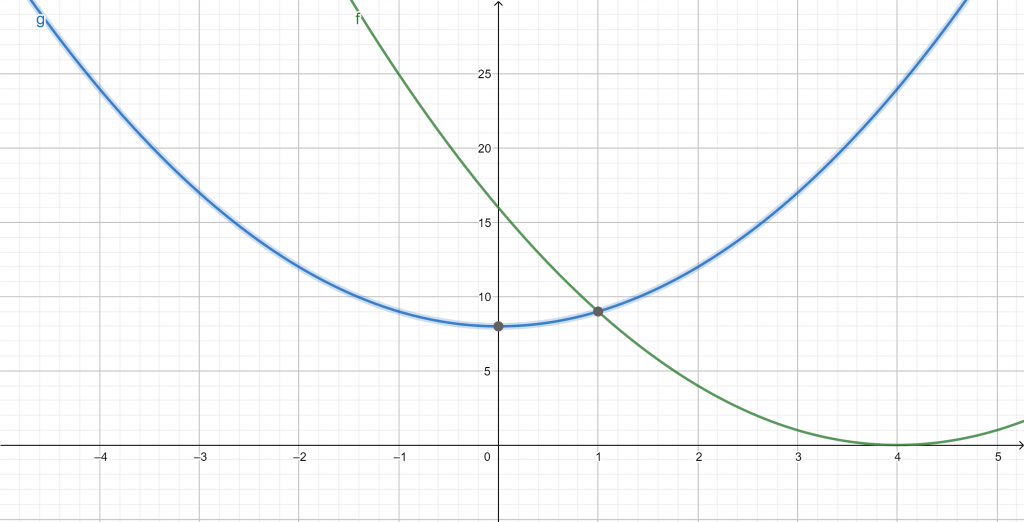
Figure 3
All images/graphs are created using GeoGebra.