JUMP TO TOPIC
One Sample T-test Calculator + Online Solver With Free Steps
The online One Sample T-test Calculator is a calculator that compares the mean of a sample data to a known value.
The One Sample T-test Calculator is a powerful tool for determining the relationship between sample data and a known data set.

What Is a One Sample T-test Calculator?
A One Sample T-test Calculator is an online calculator that helps you perform a test that allows you to determine the relationship between the sample data and the known data.
The One Sample T-test Calculator needs four inputs to work: the t-test or hypothesized mean, the sample mean, the sample standard deviation, and the size of the sample.
After inputting these values in the One Sample T-test Calculator, we can easily compare the means.
How To Use a One Sample T-test Calculator?
You can use the calculator by plugging the values in their respective boxes and clicking the “Submit” button to get the desired results.
The detailed step-by-step instructions on how to use the One Sample T-test Calculator can be found below:
Step 1
In the initial step, we enter the t-test or hypothesized mean value into the One Sample T-test Calculator.
Step 2
After we enter the t-test value, we enter the sample mean value into our calculator.
Step 3
After entering the sample mean value, we enter the sample standard deviation in the One Sample T-test Calculator.
Step 4
After inputting the sample standard deviation, we enter the last input value, the sample size, in the One Sample T-test Calculator.
Step 5
Finally, after adding all the values to the calculator, you click on the “Submit” button present on the calculator. The One Sample T-test Calculator quickly displays the relationship between the sampled data mean and known data. The calculator also plots a distribution curve representing the results.
How Does a One Sample T-test Calculator Work?
The One Sample T-test Calculator works by taking in the input values and comparing the sample data with the known sample. The One Sample T-test Calculator uses the following equation to compute the t value:
\[ t = \frac{\bar{x}-\mu}{\frac{S}{\sqrt{n}}} \]
Where:
x= the calculated mean.
$\mu$ = hypothetical mean.
S = standard deviation.
n= number of samples.
What Is a One Sample T-test?
A one-sample t-test is a test that compares your sample data’s mean to a given value. For instance, you might be curious about how your sample mean compares to the population mean. When the population standard deviation is unknown or have a small sample size, you should use a one-sample t-test.
To implement the one-sample t-test, you need to make sure the following assumptions are valid:
- The variable under investigation should be either an interval or ratio variable.
- Observations in the sample should be independent of one another.
- A variable under investigation should be roughly normally distributed. You can test this assumption by making a histogram and visually inspecting the distribution to see if it has a “bell shape.”
- There should be no outliers in the variable under investigation. Create a boxplot and visually inspect for outliers to test this premise.
Solved Examples
The One Sample T-test Calculator can instantly perform a one-sample t-test. You only need to provide the calculator with the input values.
Here are some examples solved using the One Sample T-test Calculator:
Example 1
While conducting his research, a student comes across the following values:
Hypothesized mean = 90
Sample Mean = 85
Sample Standard Deviation = 3
Sample Size = 15
The student must find the relationship between the sample mean and the known data value.
Use the One Sample T-test Calculator to find this relationship
Solution
We can easily find the t-test value using the One Sample T-test Calculator. First, we input the hypothesized mean value into the calculator; the hypothesized value mean 90. We then enter the sample mean value in the One Sample T-test Calculator; the sample means the value is 85. Now we enter the sample standard deviation value in the calculator; the value is 3. Finally, we enter the sample size into the One Sample T-test Calculator; the sample size value is 15.
After adding all the values in the One Sample T-test Calculator, we click the “Submit” button. The results appear in a new window.
The following results are from the One Sample T-test Calculator:
Null Hypothesis:
\[ \mu = 90 \]
Alternative Hypothesis:
\[ \mu < 90 \]
Test Statistic:
\[ -\sqrt{15} \approx -3.87298 \]
Degrees of freedom:
14
P Value:
\[ 8.446 \times 10^{-4} \]
Sampling distribution of test statistics under the null hypothesis:
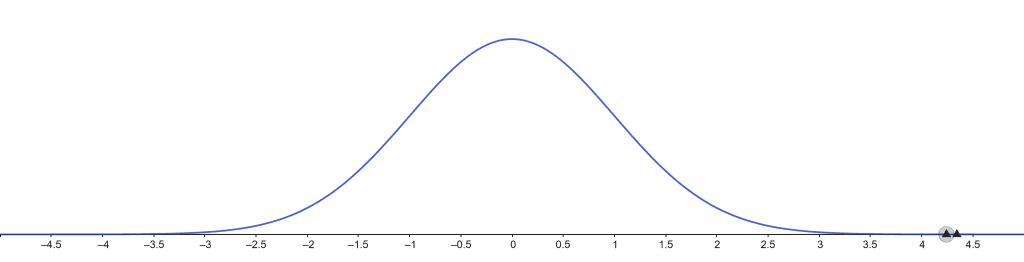
Figure 1
Test Conclusions:
The null hypothesis is rejected at a 1% significance level.
The null hypothesis is rejected at a 5% significance level.
The null hypothesis is rejected at a 10% significance level.
Example 2
Consider the following values:
Hypothesized mean = 302
Sample Mean = 300
Sample Standard Deviation = 18.5
Sample Size = 40
Use the One Sample T-test Calculator to find the relationship between the sampled and known data.
Solution
We can quickly calculate the t-test value using the One Sample T-test Calculator. First, we enter the hypothesized mean number into the calculator; the hypothesized mean value is 302. We then enter the sample mean value of 300 into the One Sample T-test Calculator. Now we enter the sample standard deviation value into the calculator; the value is 18.5. Finally, we enter the sample size into the One Sample T-test Calculator; the sample size value is 40.
We click the “Submit” button after inputting all values into the One Sample T-test Calculator. The outcomes appear in a separate window.
The One Sample T-test Calculator gives the following results:
Null Hypothesis:
\[ \mu = 302 \]
Alternative Hypothesis:
\[ \mu < 302 \]
Test Statistic:
-0.683736
Degrees of freedom:
39
P Value:
0.249
Sampling distribution of test statistics under the null hypothesis:
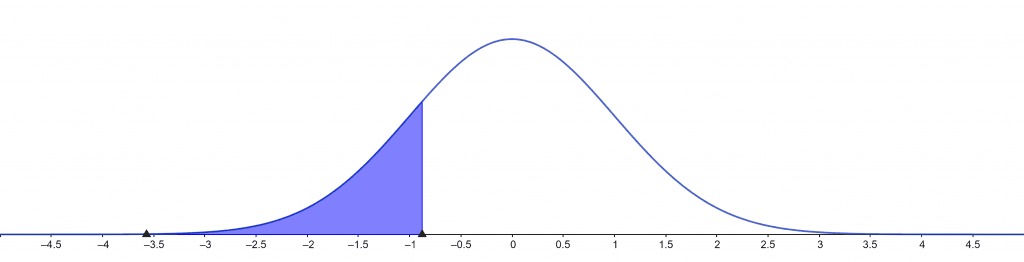
Figure 2
Test Conclusions:
The null hypothesis is not rejected at a 1% significance level.
The null hypothesis is not rejected at a 5% significance level.
The null hypothesis is not rejected at a 10% significance level.
All images/Graphs are created using GeoGebra.