JUMP TO TOPIC
Statistics
Statistics is a way of comparing groups of numbers in a population based on data collected from a sample of the population. A study of basic statistics includes descriptions of different ways to graphically display such samples, including everything from bar graphs to histographs.
Basic statistics also includes how to find and interpret descriptive elements of the population sample, including mode, median, mean, and range.
Random samples of populations can be used to make predictions about entire populations, and this concept is the basis for the advanced study of statistics that is beyond the scope of this guide.

The foundations here are used in all scientific studies to show whether an experiment on a sample is applicable to the whole population and whether or not a change shown is significant.
That is, statistics can help to interpret the results of a study in context. Psychology, health science, chemistry, biology and many other branches of physical and social science depend on these kinds of studies.
This guide begins with an introduction to statistics that contains resources on how to collect and organize data. It then includes a topic on descriptive statistics such as range, median, mode and mean, and one on graphical displays of data. After that, this guide gives resources for better understanding frequency and cumulative frequency.
Finally, the guide ends with explanations of some concepts that provide the basis for the advanced statistics used in scientific studies.
Collecting and Summarizing Data
Data is simply facts compiled together. Before any descriptive statistics can be done, and before graphical displays can be made, and before any advanced analysis can be conducted, data must be collected. It is important to remember that the quality of the data can be affected by the way in which it was collected.
For example, data about shopping habits will be different if a surveyor only talks to people entering a grocery store or only talks to people entering a shoe store.
This section introduces the most fundamental concepts in statistics. It begins by describing data and data collection before introducing and explaining the concepts of frequency and frequency tables.
Common Ways to Describe Data
How do researches make distinctions between large sets of data? They begin by using descriptive statistics! This section introduces four of the most common descriptors used to compare data sets.
It begins with mode, the most commonly appearing point or points in a set of data. It then moves onto median, the middle number in a data set. Next, the topic explains how to find the mean or average before finally introducing the concept of range, which is the span of a data set.
Different Ways to Represent Data
Statisticians actually have a lot of tools at their disposal when it comes to deciding how to display data from a sample. Data can be displayed with just numbers, or it can grouped by ranges.
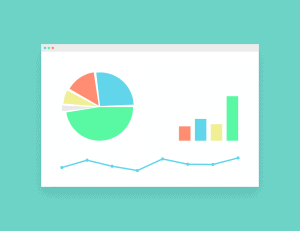
Scientists can also use descriptive statistics to create displays, as is the case in box and whiskers plots. Different displays are used for different purposes, and sometimes statisticians include multiple displays to convey different shades of meaning for one data set.
This section begins with common ways of displaying data, including tally charts, line plots, pictographs, bar graphs, line graphs, and pie charts. It then moves on to some other ways of displaying data using groups and descriptive statistics such as box and whiskers plots.
Finally, the topic ends with subtopics that explain the methods of displaying descriptive data for cross classification.
- Tally chart
- Pictograph
- Bar graph
- Line graph
- Pie chart
- Box and whisker plot
- Stem and leaf plot
- Venn diagram
- Carroll diagram
Frequency Tables
Frequency tables and their most common corresponding graphical display, histograms, reveal important information about a data set. Rather than showing individual results, frequency tables show how often different results or ranges of results occur.

The shape of a frequency table can also reveal new information about the population from which the data sample was taken. Frequency can also sometimes be used for data sets that contain qualitative rather than quantitative data.
This topic begins with frequency tables and then explains how to find different descriptive statistics using frequency tables. It also discusses how to display frequency tables graphically with a histogram.
Cumulative Frequency
Cumulative frequency deserves its own section because it can be easily confused with regular frequency. Whereas frequency shows how often an event or range of events occurs, cumulative frequency shows how likely it is that the data is less than or equal to a certain value.
This topic first explains tabular and graphical displays for cumulative frequency. It also explains how to find the median, quartiles, and percentiles for both grouped and ungrouped data.
More Advanced Statistics
Complex statistical analysis is outside the scope of this guide. Many concepts that are used for such analysis, however, are introduced here. These facts and properties provide the backbone of research analysis in many different subjects, ranging from medicine to psychology.
For example, statisticians will analyze results from clinical trials of new pharmaceutical drugs to see if their effect is significant and if they are generally safe to use.
This section begins by explaining the differences between the means and variance of populations and samples. It then introduces the concept of standard deviation and random variables.
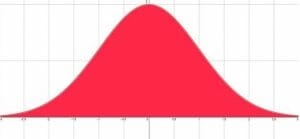
The topic also discusses some probability concepts such as density functions, binomial distributions, and expected values. Next, the topic includes information on both Poisson and normal distributions and how to use a z-score with a normal distribution.
Finally, this section concludes with an explanation of Bayes’ Theorem, a useful tool in both probability and statistics.
- Sample mean
- Population mean
- Sample variance
- Standard deviation
- Random variable
- Probability density function
- Binomial distribution
- Expected value
- Poisson distribution
- Normal distribution
- Bernoulli distribution
- Z-score
- Bayes theorem
- Normal probability plot
- Chi square
- Anova test
- Central limit theorem
- Sampling distribution
- Logistic equation
- Chebyshev’s theorem