JUMP TO TOPIC
Horizontal and Vertical Axes
A graph typically includes vertical and horizontal axes for you to peruse. The line of figures or data arranged from left to right along the side of the graph is the vertical axis. On the other hand, the horizontal axis is the line of numbers or data that runs at the bottom of the graph.

Figure 1: Illustration of axes
When examining a graph, you can discover that the axes, typically vertical and horizontal, have been given different names. In most cases, the axis that runs vertically is referred to as the y-axis, and the axis that runs horizontally is referred to as the x-axes. The place where these axes come together is known as the origin of the coordinate system.
When solving mathematical problems involving graphs, it is common to refer to the axes on the graph as the x-axis and y-axis, respectively.
One Dimension Axes
In one dimension, the axis is just a straight line with the origin in the middle, negative values to its left, and positive values to its right.
Selecting the origin or starting point (called “O” for short), a length measure, and a direction for a straight line are the three components of a Cartesian coordinate system for a one-dimensional space. One can state that a line “is orientated” (or “points”) from the negative cycle towards the positive half by deciding which of the two halves of the line given by O is the positive and which is negative.
The distance from O to each point P on the line can be given using either a plus (+) or minus (-), based on which half of the line contains P.
Two-Dimensional Axes
Two-dimensional cartesian coordinates consist of an ordered pair of perpendicular lines, a standard unit of measurement for both axes, and an orientation for each axis.

Figure 2: A line on a 2D graph with two axes
The intersection of the axes is used as the starting point for both, transforming the axes into separate number lines. Any point P can be represented numerically by the intersection of a line drawn through P perpendicular to each axis.
P’s Cartesian coordinates are those two numbers in that particular order. Using the inverse construction, one can find the coordinates of the point P and use them to identify P.
Three-Dimensional Axes
A Cartesian coordinate system for three-dimensional space comprises a single unit of measurement for all three axes, an orientation for each axis, and a set of ordered lines that pass through a center element (the origin). Each axis thus functions as a number line, just as it does in the two-dimensional case.
To determine the numerical value of a spatial point P, we look at the intersection of a hyperplane passing through P and each of the coordinate axes and interprets the point where the hyperplane and the axis meet as the coordinate for P. These three values in the selected sequence constitute P’s Cartesian coordinates. It is possible to find the location of point P given its three dimensions using the inverse construction.
Each dimension of a point P can also be interpreted as the distance between P and the hyperplane created by the additional two axes, with the value of the distance depending on the direction of the associated axis.
Data Used on 2D Graphs
Coordinates like (1, 2), (4, 5), (6, 9), etc., are going to be the most fundamental pieces of information that are plotted on these graphs.
The first value of the coordinate (also called the abscissa or x-coordinate) is determined along the axis designated as the x-axis. In contrast, the second number (often called the ordinate or y-coordinate) is measured along the axis defined as the y-axis.
These positive numbers will invariably be displayed on the graph or grid in the upper right-hand corner, also referred to as the first quadrant. Despite this, you may occasionally come across graphs in which the axes display numbers in the negative (as we will see below). The same rule applies when dealing with negative numbers: the first is along the x-axis, while the second is along the y-axis.
Octants and Quadrants
A two-dimensional Cartesian system divides the plane into four infinite regions known as quadrants, each delimited by two half-axes of the system.
These are typically numbered from first to fourth and denoted by Roman numerals: I (where both the coordinates and the abscissa have positive signs), II (where the abscissa is negative and the ordinate is positive), III (where both the abscissa and the ordinate are negative), and IV (where the abscissa is positive and the ordinate is negative).
When the axes are formed using the standard conventions, the numbering begins in the upper right (“northeast“) quadrant I. It continues around counterclockwise, with quadrants II, III, and IV representing the northwest, southwest, and southeast directions in that order.
Similarly, a three-dimensional Cartesian system defines a split of space into eight areas or octants following the signs of the coordinates of the two points. The practice of designating a particular octant by listing its signs, such as (+ + +) or (+), is considered to be the standard method.

Figure 3: Illustrating Quadrants on a 2D plane and their relationship with the axes.
Example 1
Find the quadrant of the coordinate (3, -4)?
Solution
The “3” is donated as the “X” since it lies on the horizontal axis of the graph; whereas “-4” is donated as the “Y” since it lies on the vertical axis of the graph. Since the X value is positive and the Y value is negative, the answer to the question must lie in the fourth quadrant.
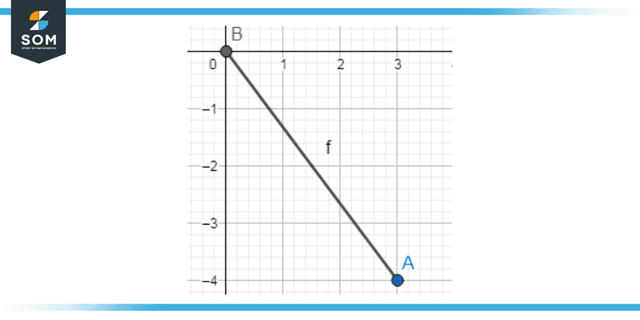
Figure 4: Displaying results from the example 1
Example 2
Draw a line between the coordinates (2, 2) and (-4, -4) also, find the quadrant of each coordinate.
Solution
The first coordinate lies in the first quadrant since both the values of “X” and “Y” lies in the positive region. The second coordinate lies in the third quadrant since the value of “X” is negative as well as the value of “Y.” The following graph indicates the line between the two coordinates:
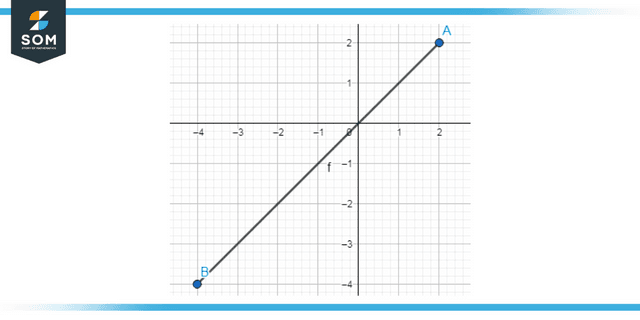
Figure 5: The resulting line from joining points A and B in Example 2
It can be noticed that the graph passes through the origin (0, 0) and has a positive gradient as the slope increases.
All images/graphs are created using GeoGebra.