JUMP TO TOPIC
Analysis of Bivariate data is remarked as the analysis of any simultaneous relation between two attributes or variables. This analysis explores the relationship between two variables as well as the deepness of this relationship to find out if there are any differences between the two variables and any reason for this difference. Some examples of Bivariate data are tables, percentages, scatter plots, etc.
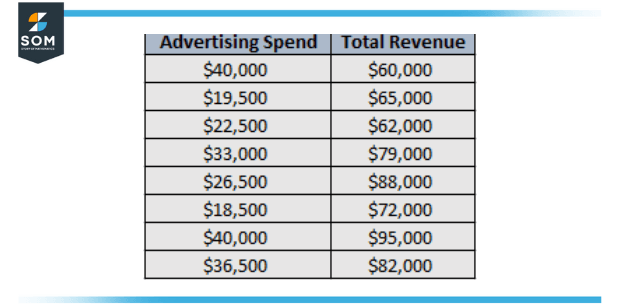
Figure 1 – two variables tabular example of business
For two variables, a scatter plot can be utilized and for analysis, a regression model or correlation coefficient can be employed to quantify the association. For two qualitative attributes, a contingency table can be utilized to display the data, and a measurement of association or a trial of independence could be utilized.
Examples of Bivariate Data
Bivariate data In statistics is the data on each of two attributes, where each value of one attribute is paired with a value of the other attribute. Generally, it would be of good to explore the possible coalition between the two attributes. The association can be analyzed via a graphical or tabular display, or by statistics which may be utilized for inference.
The technique utilized to examine the association would rely on the level of dimensions of the variable. This association that concerns exactly two variables can be called a bivariate association.
In Businesses, bivariate data can be the data about the total money expended on the advertisement and total earnings. For instance, a business may compose the figure 1 data for 8 sales quarters.
The figure 1 illustration is of bivariate data because it includes information on precisely two variables which are advertising spend and total revenue.
The Bivariate analysis of the above data is to fit a linear regression model to this dataset and find out that for each extra dollar spent on advertisement, an average of $2.61 revenue increases.
Medical researchers usually collect bivariate data to achieve a better knowledge of the connection between variables linked to health. For instance, a researcher gathers the following data regarding age and heart rate for 10 people.
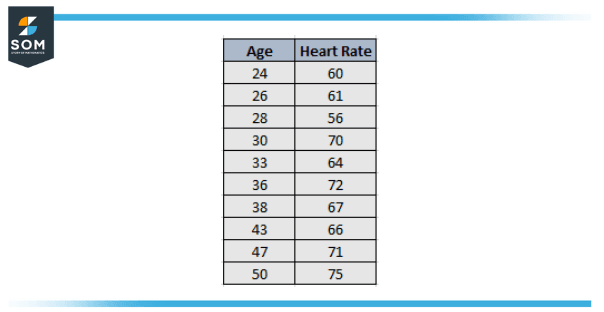
Figure 2 – Age and Heart Rate data of 10 Individuals.
The researcher can perform bivariate analysis and compute the correlation between the two variables and figure it out to be 0.832, which demonstrates that the two variables have a substantial positive correlation. That is, as age grows resting heart rate also tends to increase in a predictable way as well.
Researchers in Education often gather bivariate data to apprehend what variables impact the performance of university students. For instance, a researcher may gather data on the GPA and the number of hours studied per week for students in a particular class.
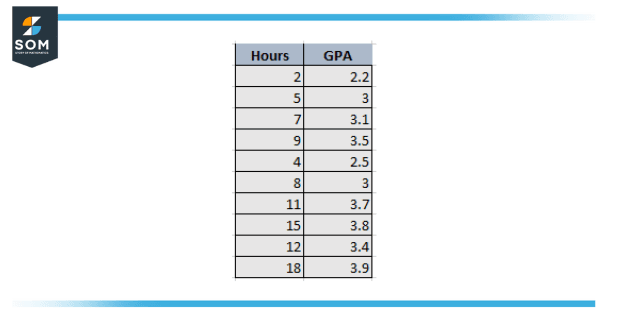
Figure 3 – Number of hours studied and the GPA
A researcher may then form a simple scatterplot to picture the relationship between the two variables.
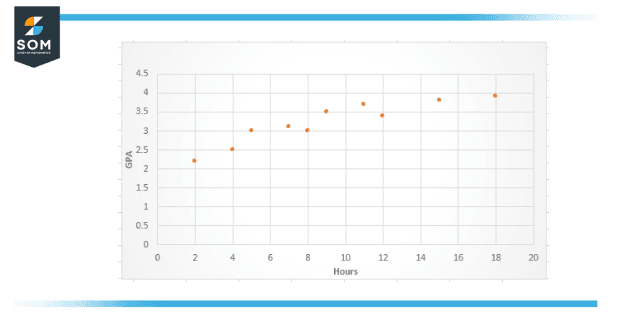
Figure 4 – Scatter Plot
Apparently, there is a positive link between the two attributes, increases in the number of hours studied per week increase the GPA of the student.
Bivariate Analysis
Bivariate analysis is a type of statistical analysis in which precisely two attributes are studied. One variable is dependent and the other variable is independent. These variables are generally denoted as X and Y. In bivariate analysis, we observe the changes that emerged between the two variables. Other than the bivariate, there are two more statistical analyses, which are Multivariate for multiple variables and Univariate for one variable.
Bivariate estimation can be discerned with analysis because in univariate only one variable is analyzed. , Univariate and bivariate analysis can be inferential or descriptive. It is the study of the link between the two variables. Bivariate analysis is straightforward a two-variable special scenario and multivariate analysis is the study of multiple relations where multiple variables are examined.
Dependent and Independent Variable
Dependent and independent variables are the variables in statistical modeling and mathematical modeling. Dependent variables acquired this term because, in an experiment, their values are observed under the assumption or directive that they depend on the values of other variables, by some rule or law. Independent variables, on other hand, are not noticed as depending on any other variable in the extent of the experimentation.
For this reason, some standard independent variables are space density, time, mass, and prior values of some experimental value of interest to forecast future values or the dependent variable.
Among the two, the dependent variable is always the variable whose divergence is being investigated, by changing inputs, also named regressors in a statistical context. Models and investigations test the results that the independent variables have on the dependent variables.
Occasionally, even if their consequence is not of explicit interest, independent variables may be retained for other causes, such as to account for their probable confounding result.
Types of Bivariate Analysis
The types of bivariate analysis will rely upon the types of attributes that are utilized for analysis. The attribute could be categorical, numerical, or ordinal. If the independent variable is categorical, like a certain brand of the chair, then probit regression can be utilized.
If independent and dependent values are ordinal, which signifies they have standing or order, then we can calculate a rank correlation coefficient. If the dependent value is ordinal, then ordered probit or ordered logit can be used. If the dependent value is either interval or ratio, like scale, or temperature then we can estimate regression.
Example Problems: Bivariate Data
Give an Example of how biologists use Bivariate Data.
Solution
Biologists frequently collect bivariate data to comprehend how two variables are linked among plants or animals. For instance, a biologist may gather data on the total number of plants and total rainfall in different areas.
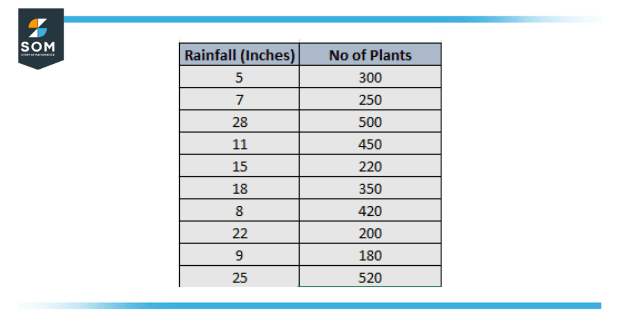
Figure 5 – Total Rainfall and No of Plants
The biologist may then determine the correlation between the two attributes and figure it out to be 0.89, indicating that there is a substantial positive correlation between the two attributes. That is, increased rainfall is closely linked with an improved number of plants in an area.
All images/mathematical drawings were created with GeoGebra.