JUMP TO TOPIC
Organizing Data Using Classes and Class Intervals
Let us consider the mark distribution of a specific class of 10 students. A set of marks of 10 students out of 25 are given: 23, 19, 12, 7, 3, 21, 17, 22, 11, and 9. From this data, we can construct a table as shown in the figure below:
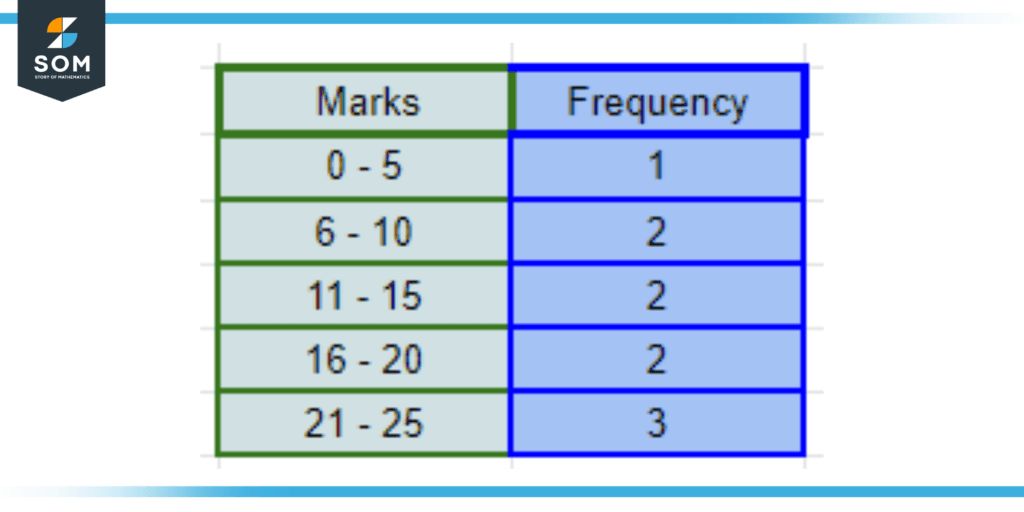
Figure 1: Distribution table indicating the distribution of marks in a class of ten students. The class interval is five marks.
From the figure, we can observe that we have five classes, each with a class interval of four marks, except for the first class having a class interval of five marks. Moreover, each class does not overlap with the other class. This is a typical example of an inclusive class interval, where the class’ limits do not overlap the succeeding class.
Moreover, this data can be used to create a histogram, which is used for a better analysis of the marks distribution of the class and identify implicit information from the data collected. This way, any data samplings can be organized and analyzed with the help of different classes and class intervals.
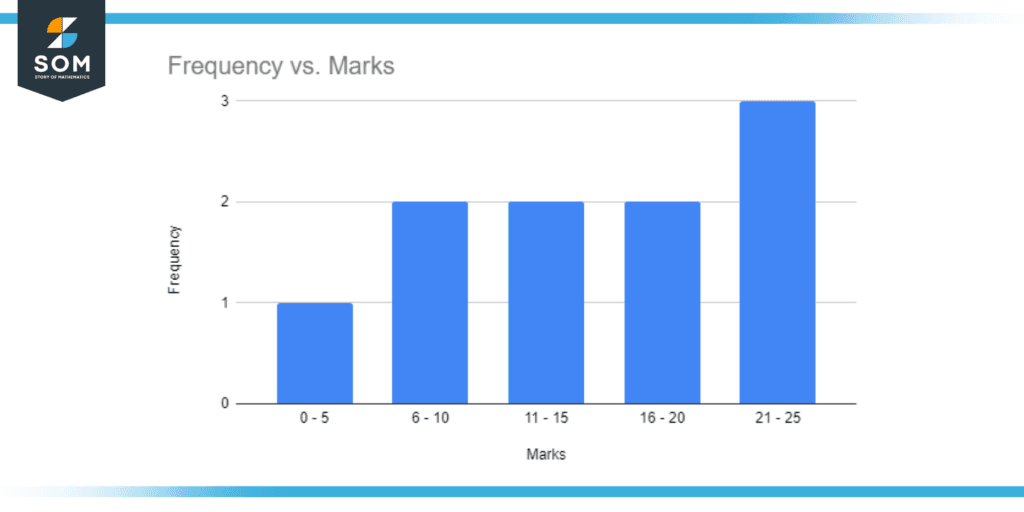
Figure 2: Histogram graph created from the frequency of the data provided in Figure 1.
Types of Class Intervals
There are two types of class intervals based on their upper and lower limits in each class: Exclusive Class Interval, and Inclusive Class Interval. These class intervals are differentiated by the upper and lower limits of one class to the succeeding class.
Exclusive Class Intervals are the type of class intervals where the upper limit of one class is equal to the lower limit of the succeeding class. Examples of such classes can be given: 10-20, 20-30, 30-40, etc. In this case, the upper limit of a class is excluded from the range of the class and the lower limit is included in the class interval range.
The other type of class interval is the Inclusive class interval, Here, the class’s upper limit of the class is different from the lower limit of the succeeding class, hence no overlapping of values occurs. Thus, we usually include both the upper and lower bounds of the class in the range of the class.
Moreover, these different types of class intervals are used for different applications. Exclusive class intervals are used in applications that involve continuous variables and samples such as the length of a leaf in a tree. Inclusive class intervals are generally used in compiling discrete variables, such as compiling the marks distribution of a class.
Significance of Class and Class Intervals
In statistics and grouped frequency distribution, the data is collected and arranged in a class, and the width of this class is known as the class interval. These classes help in organizing the data systematically and ease the process of analysis and data research in a given pool of numerical value. Furthermore, the class interval defines how wide the range of data is taken for organizing a set of values.
Using classes and their intervals, one can easily create a histogram to depict the data in a graphical format for understanding and analysis of the data by observing its trend and frequency distribution in given ranges and classes.
Classes provide a simple and organized sampling of data from a sample pool that is collected from observation, experimentations, or surveys. It is difficult to find an implicit meaning or analyze a given data pool that is disorganized and randomized with no systematic order to it. Thus, classes in a range of data provide the required order and organization to help in distinguishing the underlying information that is usually missed out while sampling data.
Additionally, the class intervals provided for a class can greatly improve the accuracy and data organization of a set of samples. In statistics, the right class interval can help greatly in the orientation of the data and analysis of given disorganized sample data.
Moreover, the data organized in classes can be used in many forms of depiction such as a histogram or a bar chart to further analyze the implicit meanings and trends that are given by the sampled data.
An Example of Class Intervals and Their Applications
Below is a table provided with the measurements of the length of thirty leaves taken from the same tree in July 2022. Group the following data into classes and find the approximate mean length of leaves of all thirty samples.
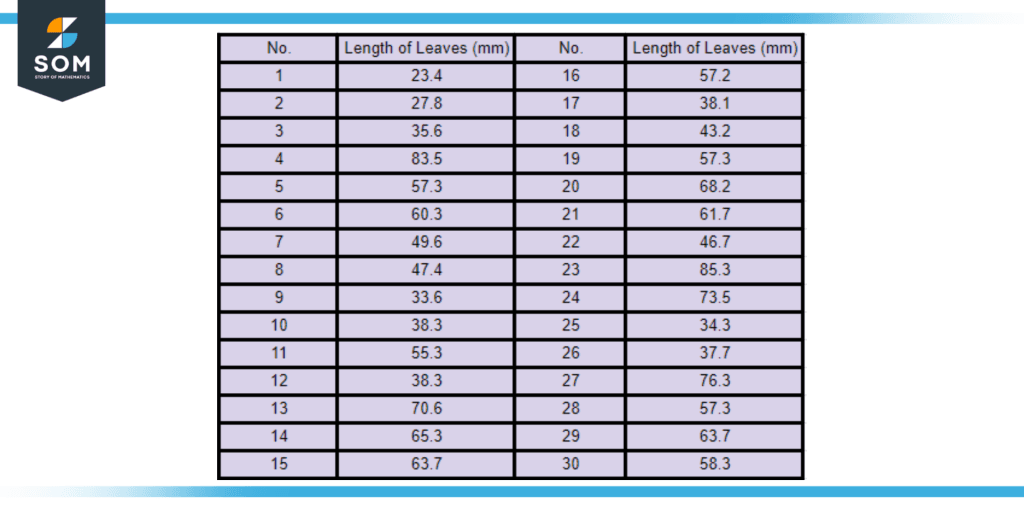
Figure 3: Dataset provided by measuring the lengths of thirty different leaves from the same tree
Solution
First of all, we create a grouped frequency table that has 7 classes: 20 – 29, 30 – 39, 40 – 49, 50 – 59, 60 – 69, 70 – 79, and 80 – 89. The class interval of the given classes is 9. This is calculated by the following process:
Class Interval = Upper bound limit – Lower bound Limit
Class Interval = 49 – 40
Class Interval = 9
Hence proven that the class interval of each class is 9.
Afterward, we try to find the average length of the leaves across the thirty samples that were measured. For that, we first find the midpoint of all the classes. After finding the midpoint, we then further group the data into the frequency of each class. These frequency values and the midpoint are multiplied to find a numerical value for each class.
Moving on, we find the sum of all seven resulting values of the above calculation to find the approximate sum of all leaves. To find the mean value, we finally divide the resulting sum by 30 to get the mean value.
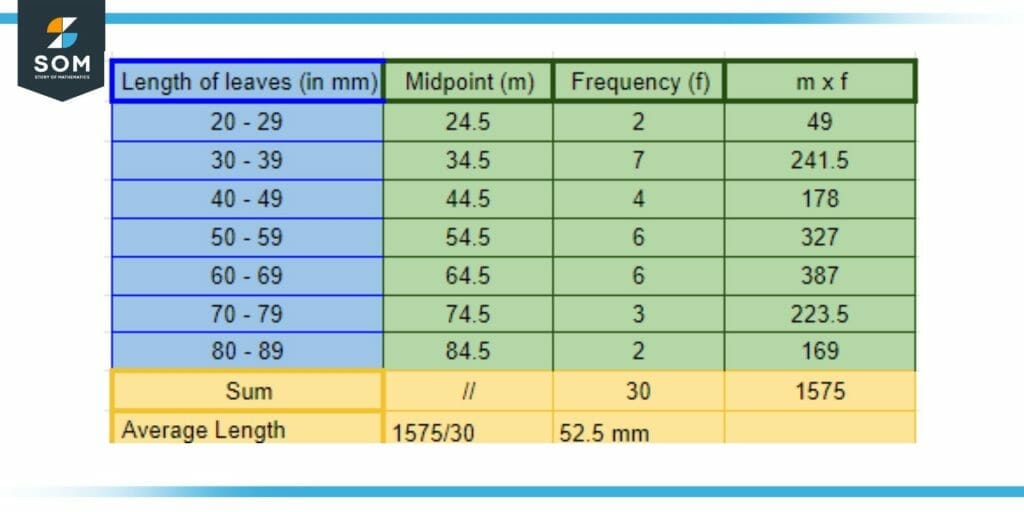
Figure 4: A grouped frequency table showing the classes of leaves and the average length of the leaf that is calculated for thirty samples
Hence our mean value calculated is 52.5 mm.
All images/mathematical drawings were created with GeoGebra.