JUMP TO TOPIC
We will focus more on columns in matrices and tables.
What Is a Column Matrix?
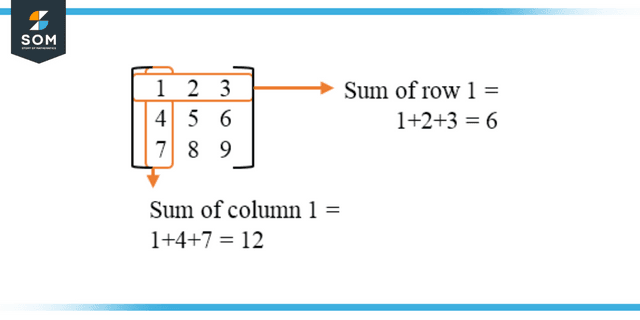
Figure 1: Rows and Columns of a Matrix
A column matrix or vector is one in which each element is organized in a separate cell. In a column matrix, the components are laid vertically, and the rank of the matrix is n times 1. A column matrix only has one column, but it can have as many rows as there are elements in each column. The number of rows is equivalent to the number of components in the column.
In short, there is just one column in a matrix, yet several rows exist. In addition to n elements, a column matrix’s order is n minus one. The elements are laid vertically, and the total number of elements is equivalent to the total number of rows in a matrix organized in a columnar fashion.
Things To Remember
- A matrix is an array of numbers represented by the symbol “matrix“.
- These specific numerical values are referred to as the matrix’s entries.
- It is possible to perform mathematical operations like addition and multiplication on matrices.
- In a matrix, the lines of vertically aligned entries are called columns, and the horizontally aligned lines are called rows.
- A column matrix is a matrix with any number of rows but only a single column. The elements of this type of matrix can be arranged in any number of rows.
- It is possible to recognize a column matrix as a rectangular matrix, and its formula is denoted by the letters.
- When working with a column matrix, addition and subtraction can only be performed using another.
- A row matrix is the only type of matrix that can multiply a column matrix. Additionally, for the multiplication of two matrices, the number of rows in the first one must equal the number of columns in the second.
Difference Between Rows and Columns
Rows and columns are two concepts that frequently get mixed up in our minds. Rows and columns can be found in every possible location. Simply put, rows are groups of cells laid out horizontally, and columns are groups of cells that either go from top to bottom or bottom to top. Rows and columns are both examples of table layouts.
Determinant of Column Matrix
If the order of the column matrix is 1 x 1, then it is possible to calculate the determinant of the matrix. If, on the other hand, the sequence of the matrix is m x 1, and m is an integer greater than one, then the determinant cannot be defined. Determinants can only be defined for square matrices because of this restriction. The higher the rank of the matrix, the difficult it will be to compute the determinant.
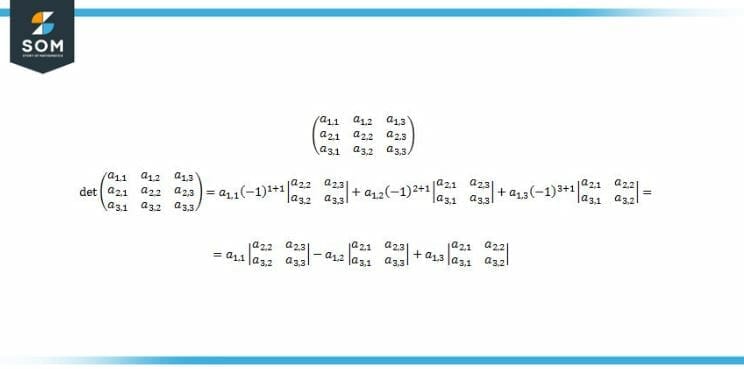
Figure 2: General Formula of Finding Determinant of 3 x 3 Matrix
Properties of Column Matrix
The following characteristics of the column matrix help gain a better comprehension of the column matrix.
- Only one column is present in a column matrix.
- The number of rows in a column matrix is relatively high.
- A column matrix has the same number of rows as elements, so the number of elements is directly proportional to the number of rows in a matrix.
- A column matrix is also a rectangular matrix.
- A row matrix can be created by transposing a column matrix into a row matrix.
- Only another column matrix with the same order as the original one can be added or subtracted from the column matrix.
- Only using a row matrix is it possible to multiply a column matrix.
- A singleton matrix results when a column and row matrix are multiplied.
Column Matrix Operations
It is possible to carry out the algebraic operations of addition, subtraction, multiplication, and division across column matrices. It is possible to perform similar operations on column matrices, such as addition and subtraction, as with any other type of matrix. Only to other column matrices can the addition or subtraction of a column matrix be performed.
A square matrix is a product obtained by multiplying a column matrix and a row matrix. In addition, the division operation cannot be performed with a column matrix because there is no such matrix as the inverse of a column matrix.
Columns in Tabulation
Each column on a worksheet is designated by a letter of the alphabet that serves as a footer and header at the bottom and top of the page, respectively. Spreadsheets in Excel can have up to 16,384 columns, so the column names go from A to XFD. In a worksheet, data is presented in columns that run vertically, from top to bottom.
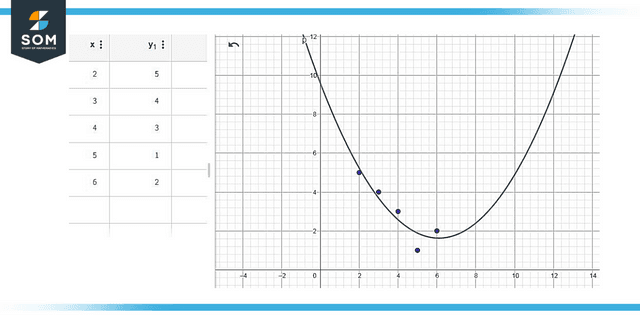
Figure 3: Graphical Representation from Columns
The columns and rows in the tabulation can help represent data simply and efficiently as shown below: A best fit quadratic line is drawn for the given values of y with respect to x. The accuracy of the graph increases as more columns are added.
Problems Involving Columns
Example 1
Find A² of the following matrix, and clearly mention the multiplication of rows and columns?
M={{1,0},{0,3}}
Solution
Considering the matrix given of rank 2, i.e. it has an equal number of rows and columns.
The first row is multiplied by the second matrix’s column. Similarly, the first row is multiplied by the second matrix’s second column to create a summation of the second element as shown below:
Row 1: [(1 + 0) (0 + 0)]
Row 2: [(0 + 0) (0 + 9)]
Combining the rows, the following matrix will be formed with columns as follow:
M²={{1,0},{0, 9}}
Example 2
A renowned author publishes a book that is read multiple times in five months; 23 times in the first month, 24 times in the second, 12 times in the third, 98 times in the fourth, and 55 times in the the fifth month. Find the cumulative frequency graph of the given data?
Solution
The given data is tabulated in form of rows and columns for greater understanding:
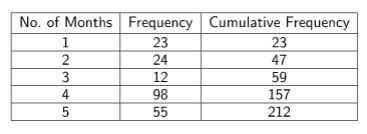
Figure 4: Cumulative Frequency Table
In the first month, 23 is the cumulative frequency; whereas, in the following month, the cumulative frequency has increased to 47 i.e. (24 + 23). Similarly, in the third month, the summation is done, and the CF becomes (47 + 12) = 59. It can be seen that tabulation of data can ease the calculation procedure.
All mathematical drawings and images were created with GeoGebra.