JUMP TO TOPIC
Data Analysis|Definition & Meaning
Definition
The process of cleansing, converting, and modeling data in order to find relevant information for effective decisions is known as data analysis. Extracting usable insights from data and making decisions based on that analysis is the goal of data analysis.
Every time we weigh the results of the past and the potential outcomes of the present when faced with a choice, we are engaging in a basic form of data analysis. It’s the method of evaluating possible outcomes and settling on a course of action.
Visual Representation of Data Analysis
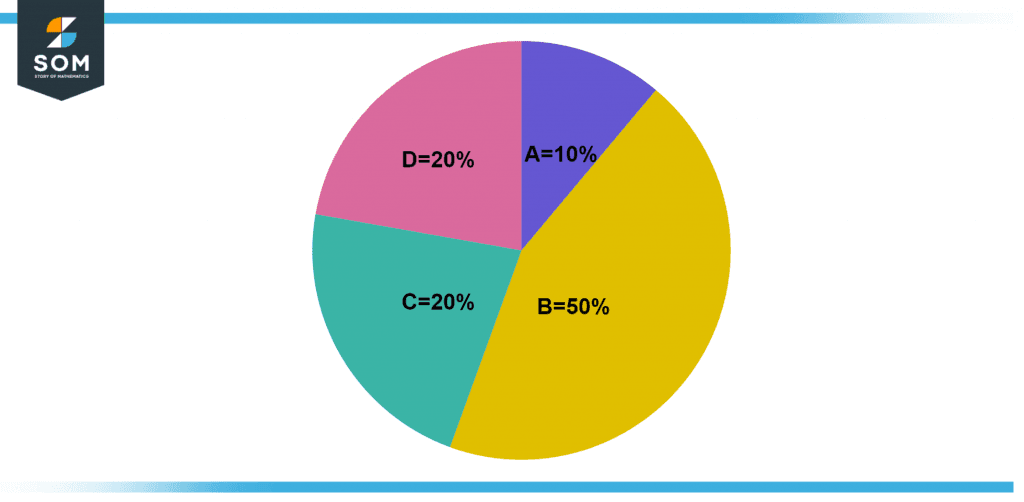
Imagine that you are interested in making a cake all by yourself. Butter, sugar, milk, and cream were some of the ingredients that went into the making of the cake that you baked. You used 10 percent butter, fifty percent sugar, thirty percent milk, and ten percent cream in your recipe. The following pie chart offers a graphical illustration of the whole breakdown of the ingredient distribution.

Figure 1 – A pie chart displaying the components of the cake-baking process.
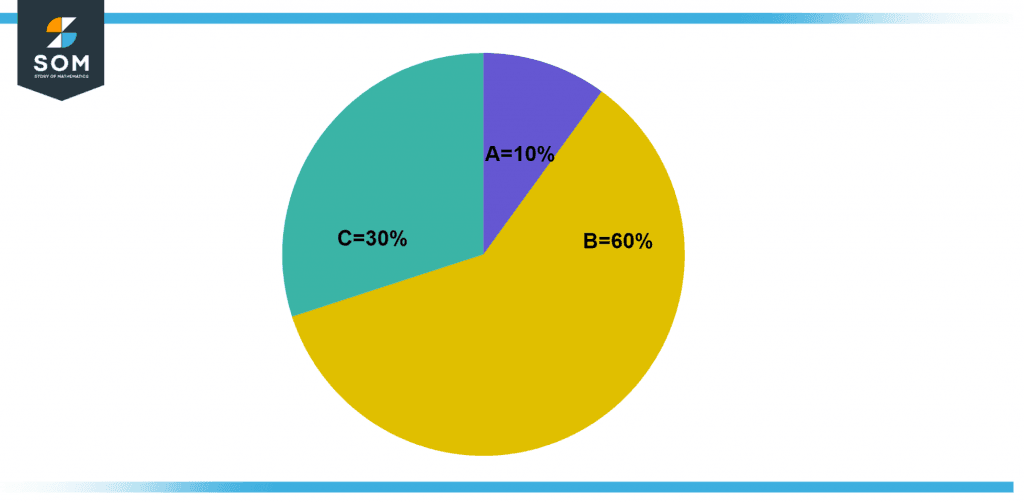
Imagine that you want to whip up a delicious ice cream shake all by yourself. Sugar, milk, and ice cream were some of the components that went into making the ice cream shake. You used ten percent sugar, sixty percent milk, and thirty percent ice cream in the recipe. The breakdown of the ingredient distribution is depicted graphically in the following pie chart that you can see below this paragraph.

Figure 2 – Elements of making an ice cream shake presented as a pie chart.
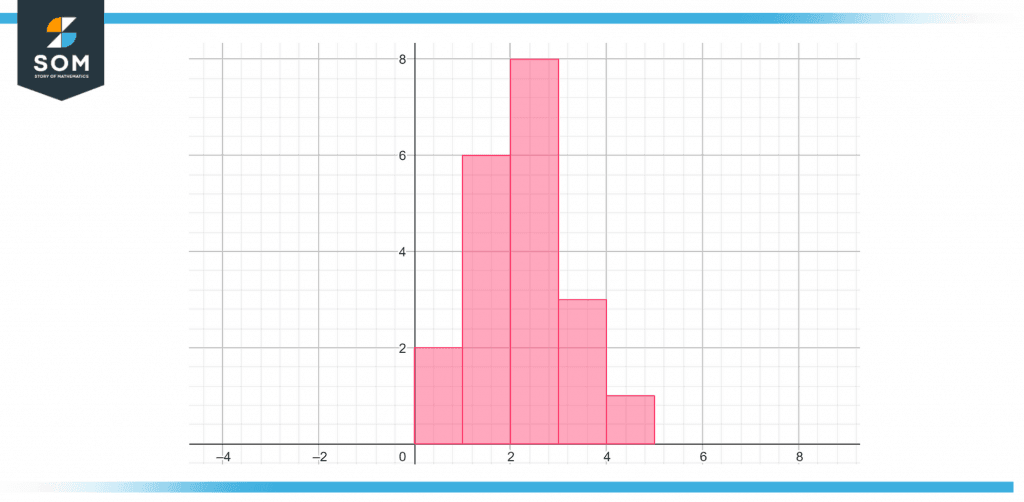
The following figure represents a histogram with five bars, each of which has the height specified for different buildings shown in the figure. The beginning of the first bar can be found at the coordinates [0, 1], the beginning of the second bar can be found at the coordinates [1, 2], and so on.

Figure 3 – Histogram for different heights of buildings.
What Steps Are Involved in Data Analysis?
The definition of data analysis is merely the first step in the process. We’ll now examine its execution. Collecting the all information, processing it, studying your data, and using it to uncover patterns and other insights are all parts of the data analysis process, often known as the data analysis phases. The steps involved in data analysis are as follows:
- Ask yourself why you’re conducting this study, what kind of information you want to employ, and what data you intend to evaluate later on.
- The next step is to gather information from your various sources using the needs you’ve already defined as guides. Studies such as case studies, polls, interviews, questionnaires, onsite observations, and focus groups are also useful. The gathered information must be properly arranged before.
- It’s time to tidy up the data you’ve collected because not all of it will be valuable. In this step, you’ll clean up your data by removing blank lines, duplicates, and simple mistakes. The information must be thoroughly cleaned before it can be sent for analysis.
- The next step, after obtaining the results you sought, is to analyze them and develop viable next steps in light of what you’ve learned.
- Data visualization means “showing your information graphically so people can read it” You can utilize a variety of tools, including charts, graphs, maps, and bulleted lists. Visualization helps users compare datasets and see relationships.
What Are the Many Forms of Data Analysis?
There are now four main methods of data analysis that are widely used in the fields of science and business. The following are:
- In order to answer this question “Why did this happen?” is found in the diagnostic analysis. Experts use method analysis to find patterns in data by using what they’ve learned from statistical methods. In a perfect world, analysts would find similar patterns from the past and use the solutions they found to solve the problems they are facing now.
- The answer to the question “What is most likely to happen?” is given by predictive analysis. Analysts can guess what will happen in the future by looking for patterns in both old data and current events. Although there is no such thought as a 100% accurate prediction, the chances are better if indeed the analysts have a large amount of detailed data as well as the discipline to look into it thoroughly.
- When you combine the insights from the other types of data analysis, you get prescriptive analysis. Sometimes, a problem can’t be solved with just one type of analysis. Instead, it needs more than one type of insight.
- The question “What happened?” can be answered by statistical analysis. This analysis looks at how dashboards are used to collect, analyze, model, interpret, and show data.
Methods for Analyzing Data
Some professionals don’t distinguish between “data analysis methods” and “data analysis techniques.” To make things even more confusing, people sometimes add the “data analysis types” that we’ve already talked about. Here, we want to make a clear distinction between the different kinds of information analysis and how they are used. Words, symbols, visual representations, and observations are all used in the qualitative data approach to obtain data. This approach does not make use of any statistics.
Methods such as Content Analysis, which examines both verbal and behavioral data, are among the most widely used qualitative research approaches. Narrative Analysis is a method for processing information obtained from sources such as interviews, diaries, and surveys.
Methods of statistical data analysis involve the collection and transformation of raw data into numerical data. For example, the mean, often known as the average, is a statistical measure that is calculated by dividing the total of a series of data by the total number of numbers in the set.
During the process, the number of persons in a sample is determined by selecting and analyzing a representative subset of the entire population. The obtained results are thought to be typical of the whole body, which allows us to hypothesize about the dataset or demography.
Artificial intelligence is currently on the rise and has already proven to be an invaluable tool in data analysis. Techniques of analysis similar to these include:
- Deep neural networks and artificial neural network
- Machine learning
What Role Does Data Analysis Play in Research?
Sorting through data is a significant portion of a researcher’s job. That is what the word “research” really means. And even the most dedicated researcher can find it hard to keep up with the constant flood of information that comes with the Information Age. Therefore, data analysis is crucial in transforming such data into a more precise and useful form, facilitating the work of researchers.
Researchers can use a wide range of diverse tools, including descriptive analysis, inferential analysis, as well as quantitative analysis, thanks to data analysis.
In the end, data analysis gives academics better information and better ways to study and analyze this information.
Example of Data Analysis
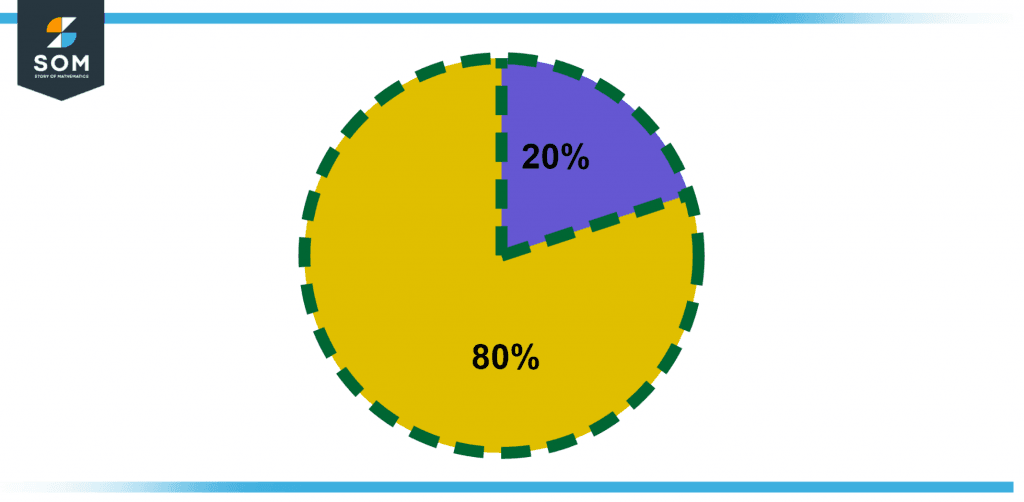
Construct a pie chart to graphically present the twenty percent of one hundred.
Solution
We have to find the 20 percent of 100. So,
20 percent of 100 = (20 /100 ) x 100
20 percent of 100 = (0.2 ) x 100
20 percent of 100 = 20
Thus, 20 percent of 100 is 20.

Figure 4 – Visual representation of 20 percent of 100.
The blue region of the pie chart represents 20 percent of 100 while the remaining 80 percent is represented in the yellow region.
All images/mathematical drawings were created with GeoGebra.
