JUMP TO TOPIC
Data can be any group of characters that is compiled and translated for some meaning, usually research. Data doesn’t do anything to a human or any computer if it is not translated to have a meaning.
What Is Data in Math?
Data in math is a group of facts and figures that can be in either numerical form or non-numerical form. Numerical data is the one you can compute. Numerical data is composed of numeric forms, such as the marks of students in class, the wages of players on a football team, and the height of workers in an organization.
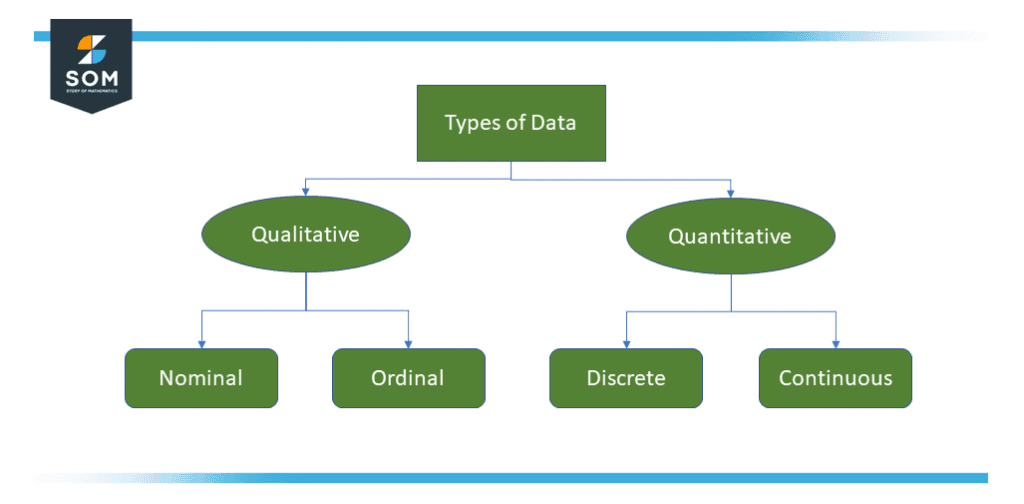
Figure 1 – Types of data in math.
Data that can only be collected and not computed is called Non-numerical data. Examples of Non-numerical data are the personality of a person or the animal’s physical appearance. Non-numerical data can be any observation that does not include numbers. The taste of some food or the color of a pencil are also some examples of numeric data.
Types of Data in Math
Figure 1 categorizes the types of data we usually encounter in math. Below, we dive deeper into their descriptions.
Qualitative Data
Qualitative data, also known as categorical data, defines the data that checks into types. Qualitative data are not numerical. Categorical information describes the features such as a person’s hometown, or sex, etc. Categorical data is described in terms of language, but not in terms of numbers.
Although sometimes categorical data can have numerical values (quantitative value), those values do not make much sense in a mathematical way. Examples of categorical data are date of birth, favorite sport, and school ID. Here, the date of birth and school ID holds the quantitative value, but it does not give a numerical sense.
Nominal Data
Nominal data comes under the types of qualitative data which helps to mark the variables without feeding the numerical value. The nominal scale is also a name for nominal data. It cannot be called and gauged. Some examples of nominal data are applications, words, emails, gender, etc.
The nominal data are analyzed by operating the grouping technique. In this technique, the data is divided into classifications by forming groups, and then the percentage of the data can be estimated. To visually represent the data, we use pie charts.
Ordinal Data
Ordinal data is a sort of data that obeys a natural order. The difference between the values is not determined which is an important feature of the nominal data. This variable is mostly seen in surveys, questionnaires, economics, and so on.
The ordinal data is generally represented using a bar chart. These data are looked into and analyzed through many visualization tools. The knowledge may be represented using tables in which each row in the table shows a different category.
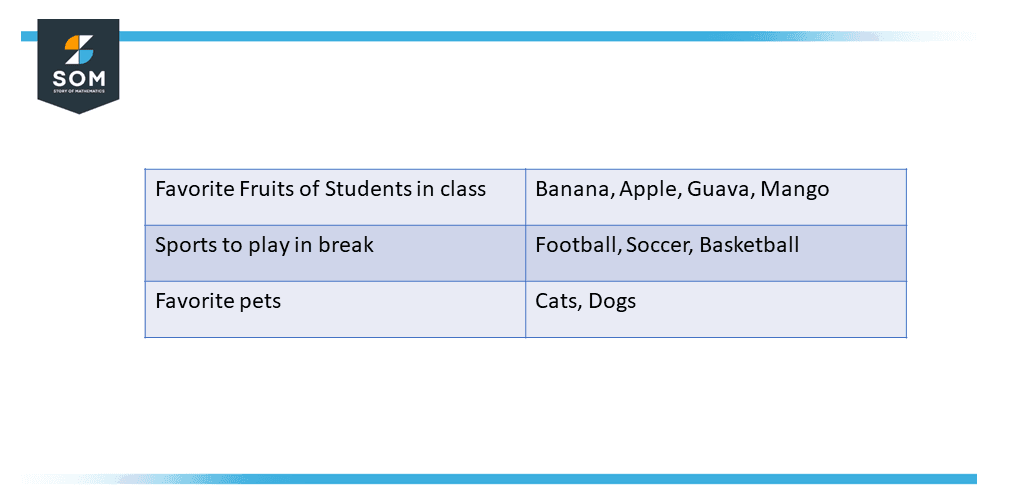
Figure 2 – Example of qualitative data.
Quantitative Data
Quantitative data is also understood as numerical data which illustrates the numerical value (i.e., how much, how many). Numerical data provides details about the quantities of a distinctive thing. Numerical data can be the length, size, height, distance, weight, and so on. Quantitative data can be categorized into two separate types based on the data sets. The numerical data is divided in two further categories that are discrete data and continuous data.
Discrete Data
Data comprised of discrete values is called Discrete data. Discrete information comprises only a limited number of conceivable values. Those values cannot be subdivided without them being meaningless. Things can be estimated in whole numbers here. The number of people attended the gym in January is an example of Discrete data.
Continuous Data
Continuous data is data that can be computed. It has an infinite number of potential values that can be set within a given distinct range.
Example: Range of temperature.
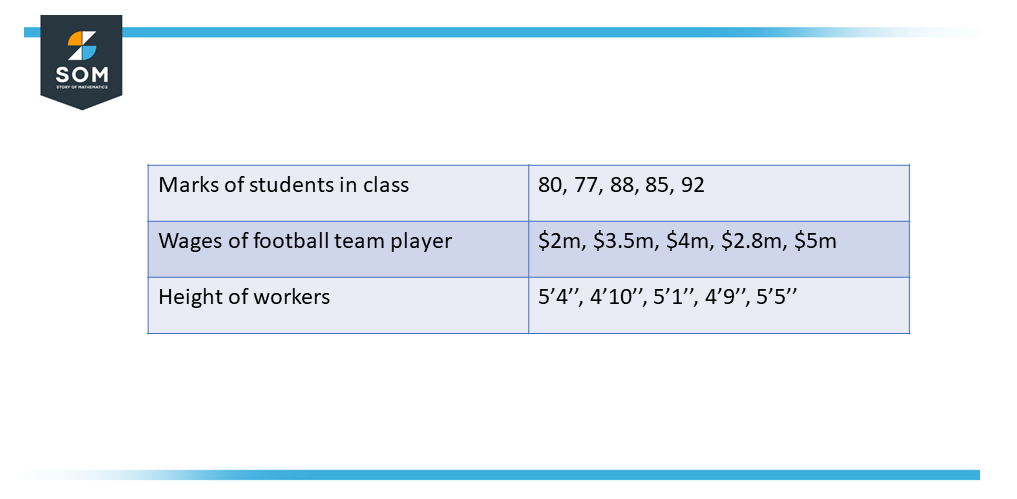
Figure 3 – Example of quantitative data.
Further Classification Into Primary and Secondary Data
Primary data is authentic knowledge that has been gathered for a specific purpose. It is the pure and natural form of information that has never been worked upon. It is systematized in a structured way so it will be useful in the future. Primary data can be qualitative or quantitative but it can never be emanated from another reference. Census is an instance of primary data.
Data that is derived from a current data source, either in an unpublished or published document is called Secondary Data. It can be any data which is already been gathered and is reachable to any researcher for their use. Secondary Data can also be a primary data source. Information in government statistics, or journals, etc which are extracted from some primary information are examples of such data.
Data in Computers
In computing, data is the knowledge that has been translated into a form that is meaningful for movement or processing. Proximate to today’s computers and transmission media, data is information altered into binary digital form. It is permissible for data to be utilized as a plural subject or a singular subject. Raw data is a phrase utilized to explain data in its most authentic or basic digital format.
Data Processing Cycle
Data processing is defined as the structuring of data again by people or devices to increase its usability and add value to a specific role or meaning. Generally, data processing consists of three basic stages which are input, processing, and output respectively. Together, the data processing cycle is made up of these three steps.
Input: The data being input gets formulated for processing in a suitable form that depends on the machine holding the main processing.
Processing: Next, the input data’s form is transformed into something more meaningful or useful for the processor. For example, information from the clock is used to calculate time.
Output: In the last stage, the results of processing are compiled as output data, with its final state relying on the requirement of the user.
Example of Utilizing Data for Meaningful Information
The height of students from one class is mentioned below:
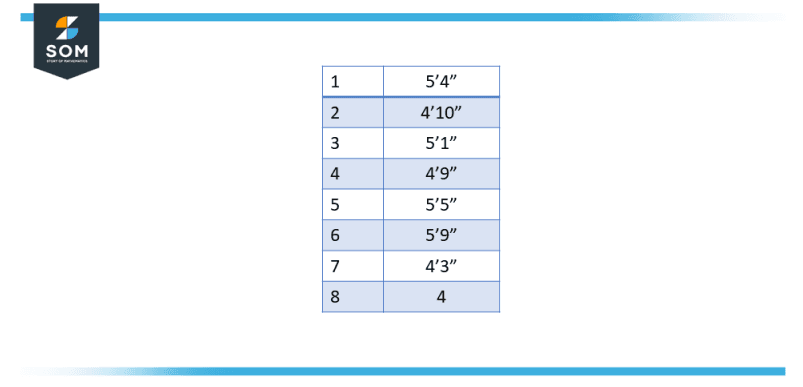
Figure 4 – Height of students in a class.
Who is the shortest and tallest boy in the class?
Solution
1 foot is equal to 12 inches.
After arranging the data in ascending order:
4′, 4’3″, 4’9″, 4’10”, 5’1″, 5’4″, 5’5″ 5’9″
The height of the tallest student is 5 feet 9 inches, and the height of the shortest student is 4 feet.
All images/mathematical drawings were created with GeoGebra.