JUMP TO TOPIC
A diagram can be used for a variety of purposes, including clarifying a topic, simplifying a process, and illustrating the relationships between pieces. The contents of a diagram can determine its classification. There are four significant types of diagrams: flowcharts, organization charts, mind maps, and infographics.
Diagrams are very helpful in explaining concepts. The following diagram represents the illustration of two different polygons of different sizes.
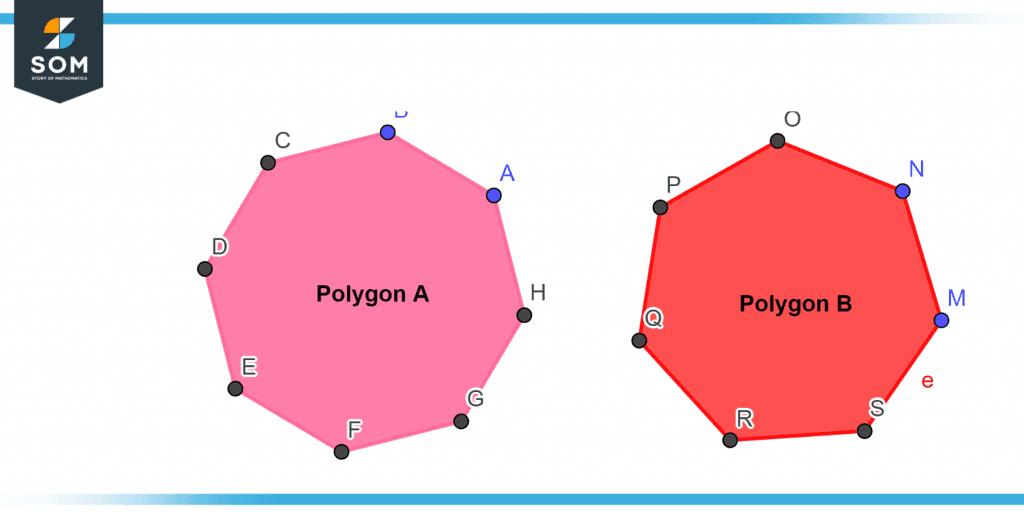
Figure 1 – Representation of two different polygons
Flowcharts are used to depict the sequence or flow of events that comprise a process. The organizational structure of a corporation or organization is represented through org charts. Mind maps are visual depictions of concepts, ideas, or procedures. Infographics are utilized to visually communicate complex data or information.
What Are Mathematical Diagrams?
Diagrams in mathematics are graphical representations of mathematical concepts. They can be used to demonstrate relationships between variables, equations, and the outcomes of calculations. Moreover, mathematical diagrams can be used to represent abstract notions such as the four-dimensional space of general relativity.
Let’s begin by examining the simplest sort of mathematical diagrams: equation diagrams. Equations are the core of mathematics and can be visually depicted in a variety of ways. A linear equation, for instance, can be represented by a line that passes through two points, one of which represents the left-hand side of the equation and the other representing the right-hand side. Similarly, a parabola can represent a quadratic equation. This style of graphic is excellent for illustrating the relationship between the equation’s variables.
In addition to diagrams of equations, mathematical diagrams can also be employed to depict the relationships between various variables. A Venn diagram, for instance, can be used to illustrate the links among two or more sets of items. This sort of diagram is excellent for depicting logical relationships, such as subset relationships. Similar to a Venn diagram, a spider diagram can be used to show the relationships between related concepts, such as the steps of a process.
Summary of Mathematical Diagrams
In summary, mathematical diagrams are valuable visualization tools for mathematical topics. They can be used to demonstrate equations, indicate relationships between variables, display calculation results, and visualize abstract concepts.
How Do Diagrams Facilitate Mathematical Visualization?
Diagrams are an effective method for visualizing mathematical concepts and elucidating difficult ideas. By presenting a visual depiction of mathematical ideas, diagrams can facilitate comprehension and memorization. Additionally, diagrams provide information in a manner that is more intuitive as well as simpler to comprehend than words alone.
Numerous mathematical concepts can be illustrated using diagrams. For instance, they can be used to illustrate algebra, geometry, calculus, as well as trigonometry ideas. Also represented by diagrams are equations as well as other mathematical equations. They can be used to illustrate the relationships between various variables and the attributes of different functions.
Diagrams may often be used to illustrate the relationship between various mathematical topics. Diagrams can be used, for instance, to demonstrate how two distinct functions might be joined to give a new result. Diagrams may also be utilized to demonstrate how two distinct equations might be solved to obtain a specific answer.
Summary
To conclude, diagrams are an effective method for visualizing mathematical concepts and contributing to the explanation of complicated topics. It is possible to use them to demonstrate a wide range of mathematical ideas, to symbolize equations as well as other mathematical equations, and also to depict the relationships that exist between the various variables. Not only may data be represented through the use of diagrams, but mathematical concepts can also be represented through the use of diagrams in a way that is more easily understood than through the use of words alone. Diagrams, which offer a graphical depiction of mathematical ideas, can make it much simpler to comprehend and retain mathematical information.
Why Math Diagrams Are Helpful
When it comes to math, diagrams can be very helpful because they provide a visual illustration of ideas and equations that might be hard to understand. Diagrams can be employed to show how problems work, show how different things are connected, and help people understand math better.
Diagrams can be employed to break up hard problems into parts that are easier to understand. A diagram can show how the different parts of an equation fit together, making it simpler to understand how they work. This could help students figure out why some things have to be done in a particular order. It can also help figure out what steps need to be taken to solve the problem.
Diagrams may also be employed to show how different parts relate to each other. Diagrams can be employed to show, for example, how points, lines, as well as shapes connect to each other. Diagrams can also be employed to illustrate the relationships among variables, like the relationship between both the width and height of a triangle.
The complexity of mathematical concepts can also be illustrated via diagrams. The concept of infinity, for instance, is difficult to grasp without a visual representation, which can be provided through a diagram. To better grasp the likelihood of an event, diagrams can be used to visually represent the notion of probability.
Answers to arithmetic problems can also be represented graphically using diagrams. Equation solutions can be shown using diagrams, which aids in comprehending the reasoning behind the correctness of the answers.
To sum up, diagrams are great tools for grasping complex mathematical concepts. You can use a diagram to visualize the solution to a math problem, examine data, emphasize relationships between components, and more. Students can improve their mathematical understanding and problem-solving abilities through the use of diagrams.
Representation of Mathematical Diagrams
When it comes to elucidating ideas, diagrams are of great assistance. The following diagram is an illustration of different functions, one of which is a sin function and the other is a natural log function.
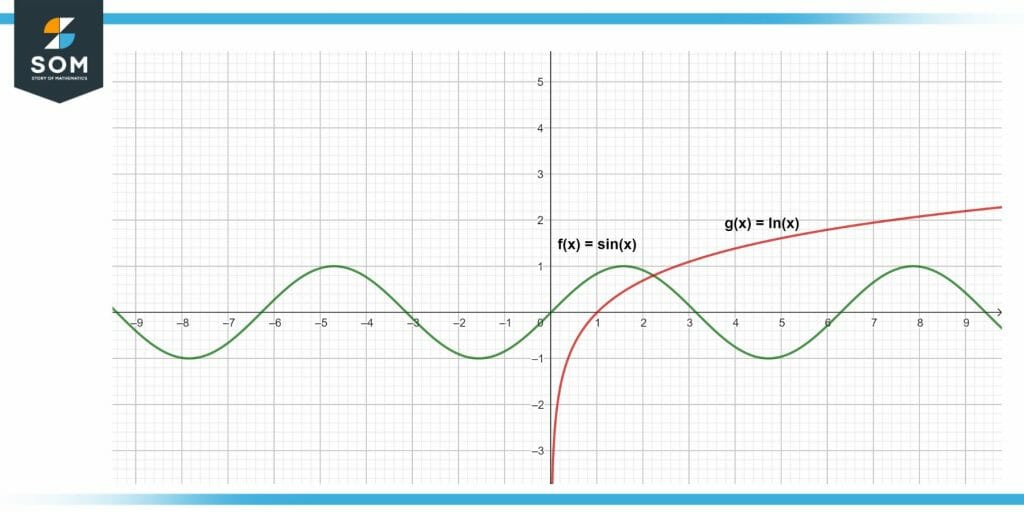
Figure 2 – Illustration of different functions
The diagram below represents the cos and sin function graphically.
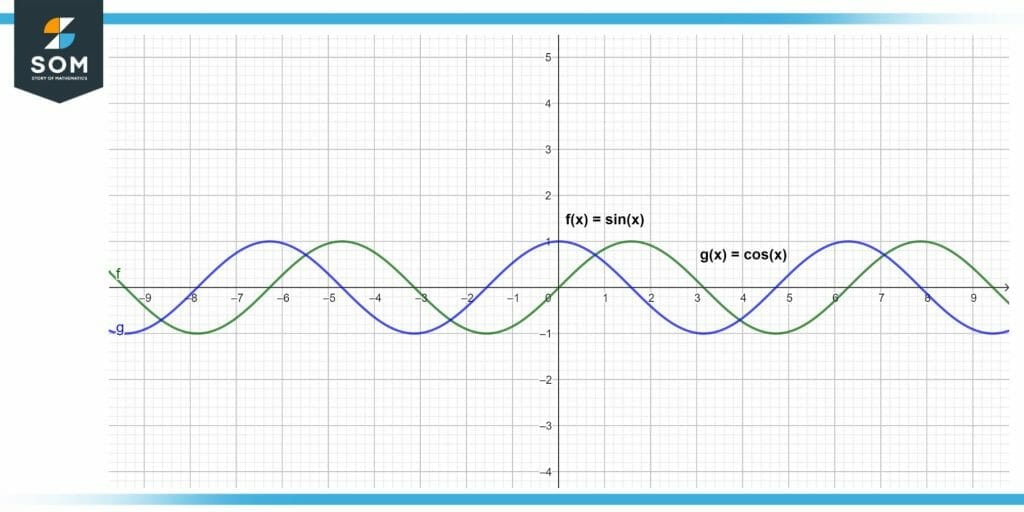
Figure 3 – Graphical representation of sin and cos function.
The graphical depiction of the various functions is shown in the figure below.
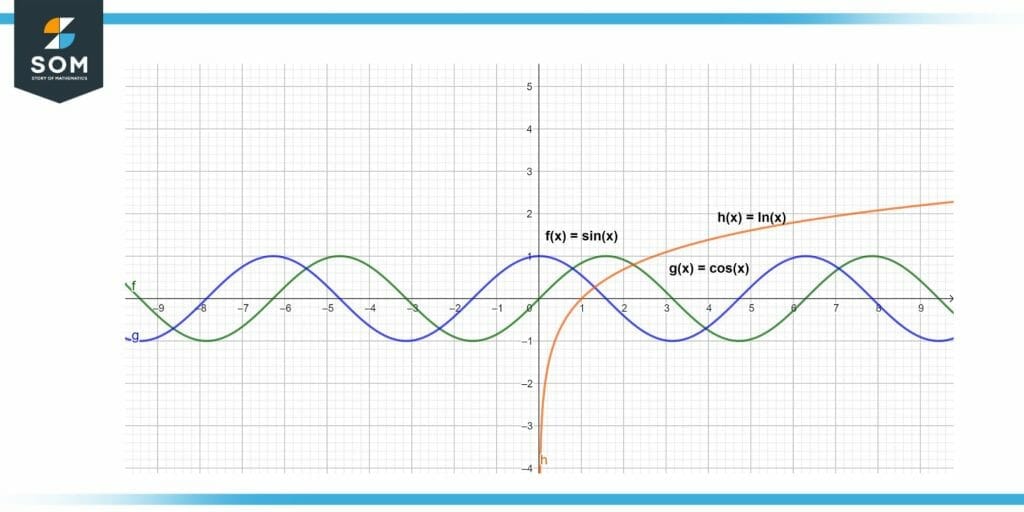
Figure 4 – Visual representation of different functions
Example of a Diagram
Example
Represent 2sin(50) with the help of a graph.
Solution
Given the expression 2sin(50), we have to represent it with the help of a diagram. Here, we will use a Cartesian Graph to show the result.
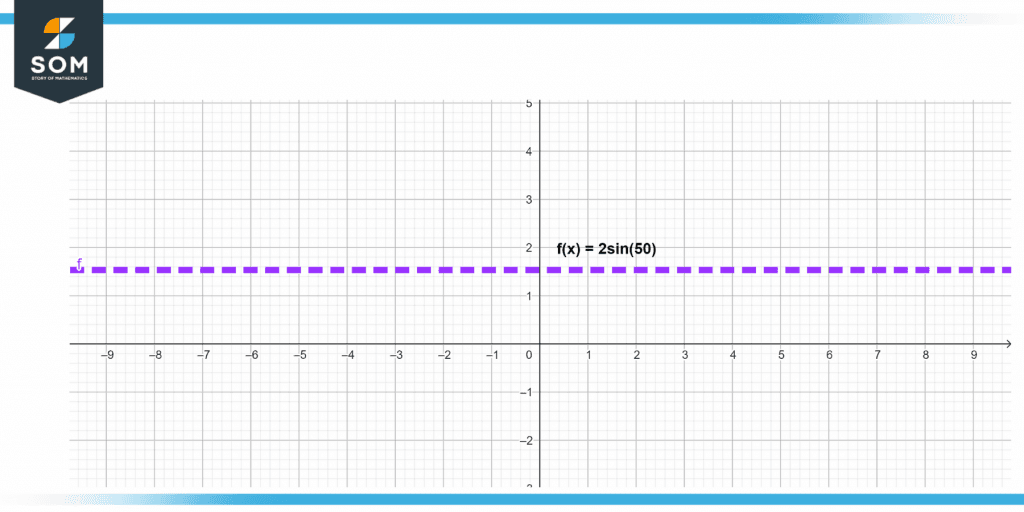
Figure 5 – Visual representation of a function
All mathematical drawings and images were created with GeoGebra.