JUMP TO TOPIC
Explanation of Discrete Data
Data is known as the raw information that has been collected through various processes. For our ease, we have categorized data into branches and subbranches as well. When the data has been analyzed then it is known as statistics of the information that was provided.
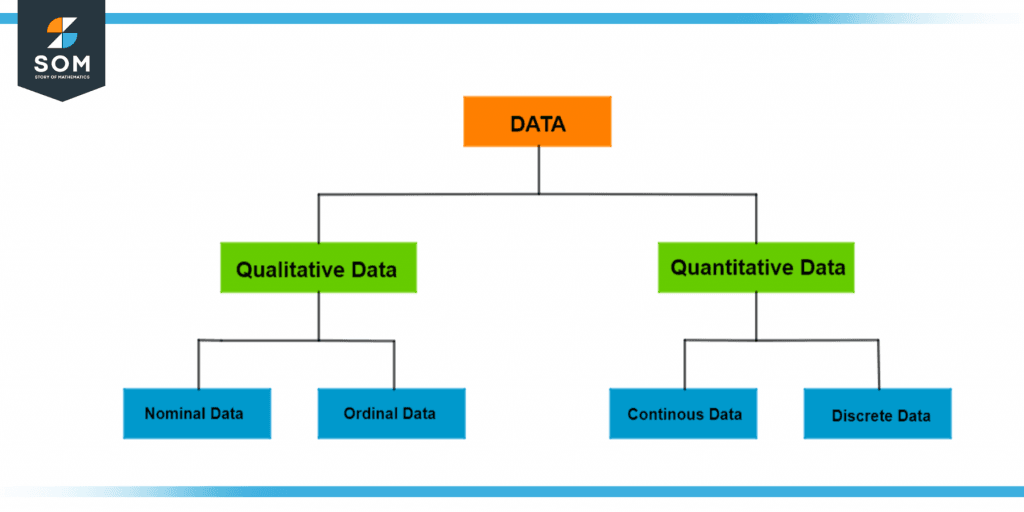
Figure 1 – Data types and their branches
From the figure above, we can say that data has been divided into 4 parts
- Nominal
- Ordinal
- Continuous
- Discrete
Discrete Data is one of the types of quantitative data, which is a collection of images and statistics of whole number data type which lies in the finite range because discrete data has to be countable. It is a data type that is based on the proportions or occurrence of any events. All the data included in this category are counted as positive integers.
For a better understanding, let us take a look at an example. A pizza store has recently introduced 5 new toppings, which is why there is a particularly long queue of 500 people outside. The most common order includes these 2 toppings: honey-laced pepperoni and pineapple onions.
From this example, the data that we can collect is:
- 500 people queue outside of the store
- 2 flavors which are the most common among customers.
Difference Between Discrete and Continuous Data
Discrete data is the set that only includes certain values or single-point data. There are no fractional values or negative integers in it. All this data exists in the finite range, making it countable. Such data can not be divided into smaller parts. Some examples of discrete data are as given below:
- The number of students on a bus
- The number of new paint boxes in a store
- The number of agreements signed between two companies
Continuous data is the type of data which is needed to be measured. It includes values that are not fixed and lie in the infinite range. Such measurements can be divided into smaller parts no matter how small the numbers get. The values are placed in a particular range and are measured continuously over time. We use continuous data in histograms as the change over time makes it easy to visualize data. Some examples of continuous data are given below:
- The age of a person
- The weather in any area
- The range of frequencies in the radio
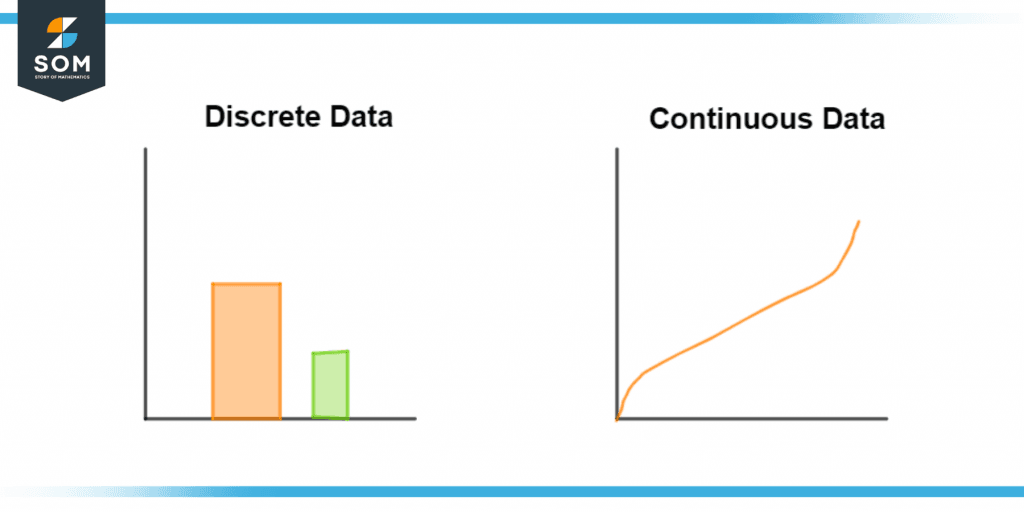
Figure 2 – Difference Between Discrete and Continous Data
Discrete and continuous data are considered the same due to having numerical data, but they are actually complete opposites of each other. One of the basic differences is the range of these numbers. Discrete data is countable, meaning it is a finite set of data, whereas continuous data has an infinite range. Moreover, continuous data can be measured, whereas discrete data is fixed and can not be divided into smaller parts.
Drawbacks of Discrete Data
Discrete data has fixed values, so it requires many samples for graphical and statistical analysis. This process not only becomes time taking but is also quite expensive. To visualize discrete data, you need to be more comprehensive, whereas continuous data requires clear instructions and is easy to use.
To collect and generate discrete data, the categories must be defined properly. To get accurate data, a data analyst must check and correct any mistakes made by humans and the machine collecting the data. All such issues must be resolved before data collection, making it a tricky task.
Real-life Examples of Discrete Data
Some real-life examples of discrete data are given below:
- Number of movie ticket sales
- Frequency counts of eye color
- Result of students in 10th grade
- Probability of dice rolls
- Number of books in the library
- Total food items on the menu
- Number of plants in the garden
- Number of cars in the garage
- Total number of patients in the hospital
- Population analysis of a country
Methods of Concept Illustration
To understand and process information, sometimes we need to use graphical tools to assist us in presenting data so that it becomes easy for the viewer. By doing so, we can check the performance, resolve any issues or debug a problem that might occur. Some of the ways by which we can graphically represent discrete data are as below:
Bar Graphs
Bar graphs are used to plot data for comparison purposes (mainly). Data must be categorized first.
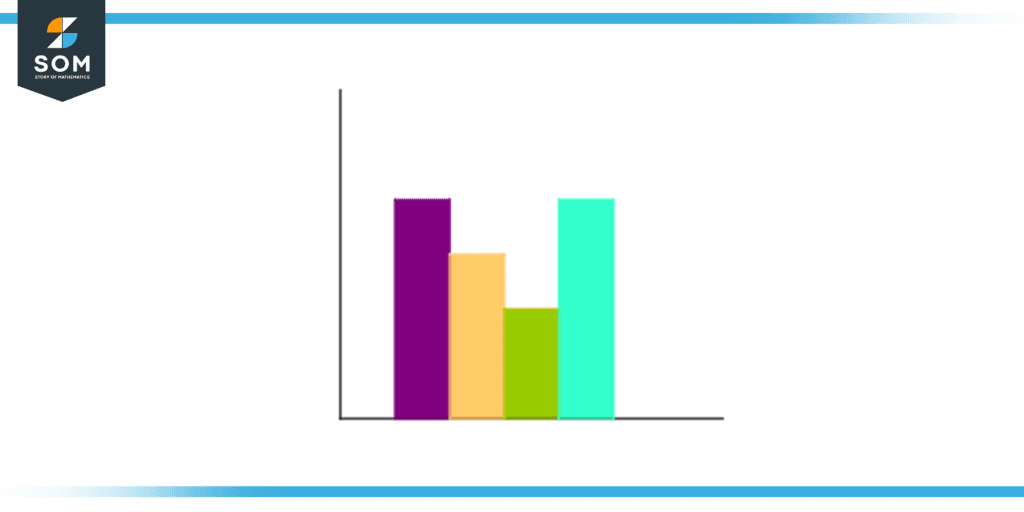
Figure 3 – Bar Graph of Data
Frequency Tables
It is a basic chart that has been divided into a category side and a numerals side. Due to the numeric side, it helps to visualize the in-demand product or most popular option.
Plotted Points
A plotted points graph is the conventional form of a graph where we have an x-axis and a y-axis in which data has been plotted. It is used when the data samples are limited, and the goal is to find general trends.
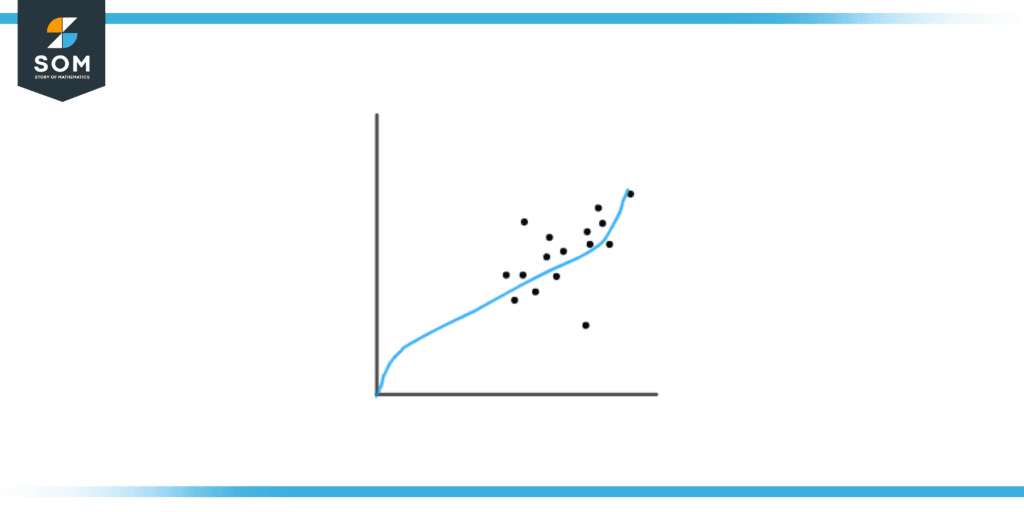
Figure 4 – Plotted Point Graph of Data
Solved Examples of Discrete Data
Example 1
The following data shows 10 students’ ages. Compile the data and find out whether it is discrete data or not.
- John, 8
- Ella, 10
- Kevin, 9
- Troy, 12
- Nicole,12
- Ted, 9
- James, 9
- Lily, 10
- Ryan, 9
- Hannah, 9
Solution
First, we will categorize data according to age:
Age 8: 1 student
Age 9: 5 students
Age 10: 2 students
Age 12: 2 students
From the data that has been given, we can conclude it to be discrete data as it has whole numbers and is countable.
Example 2
From the variables given below, identify discrete data.
- Shoe size of men
- Number of books in the library
- Weight of students in a class
Solution
- The shoe size of men is discrete data because the range of shoe size is fixed and finite. We can easily count it.
- The number of books in a library is also discrete data because we can count them, and the amount exists in a whole number format.
- The weight of students is continuous data, not discrete data as there is an infinite number of weights that can exist and all of these weights must be measured.
All images/mathematical drawings are created with GeoGebra.