JUMP TO TOPIC
Conceptual Overview
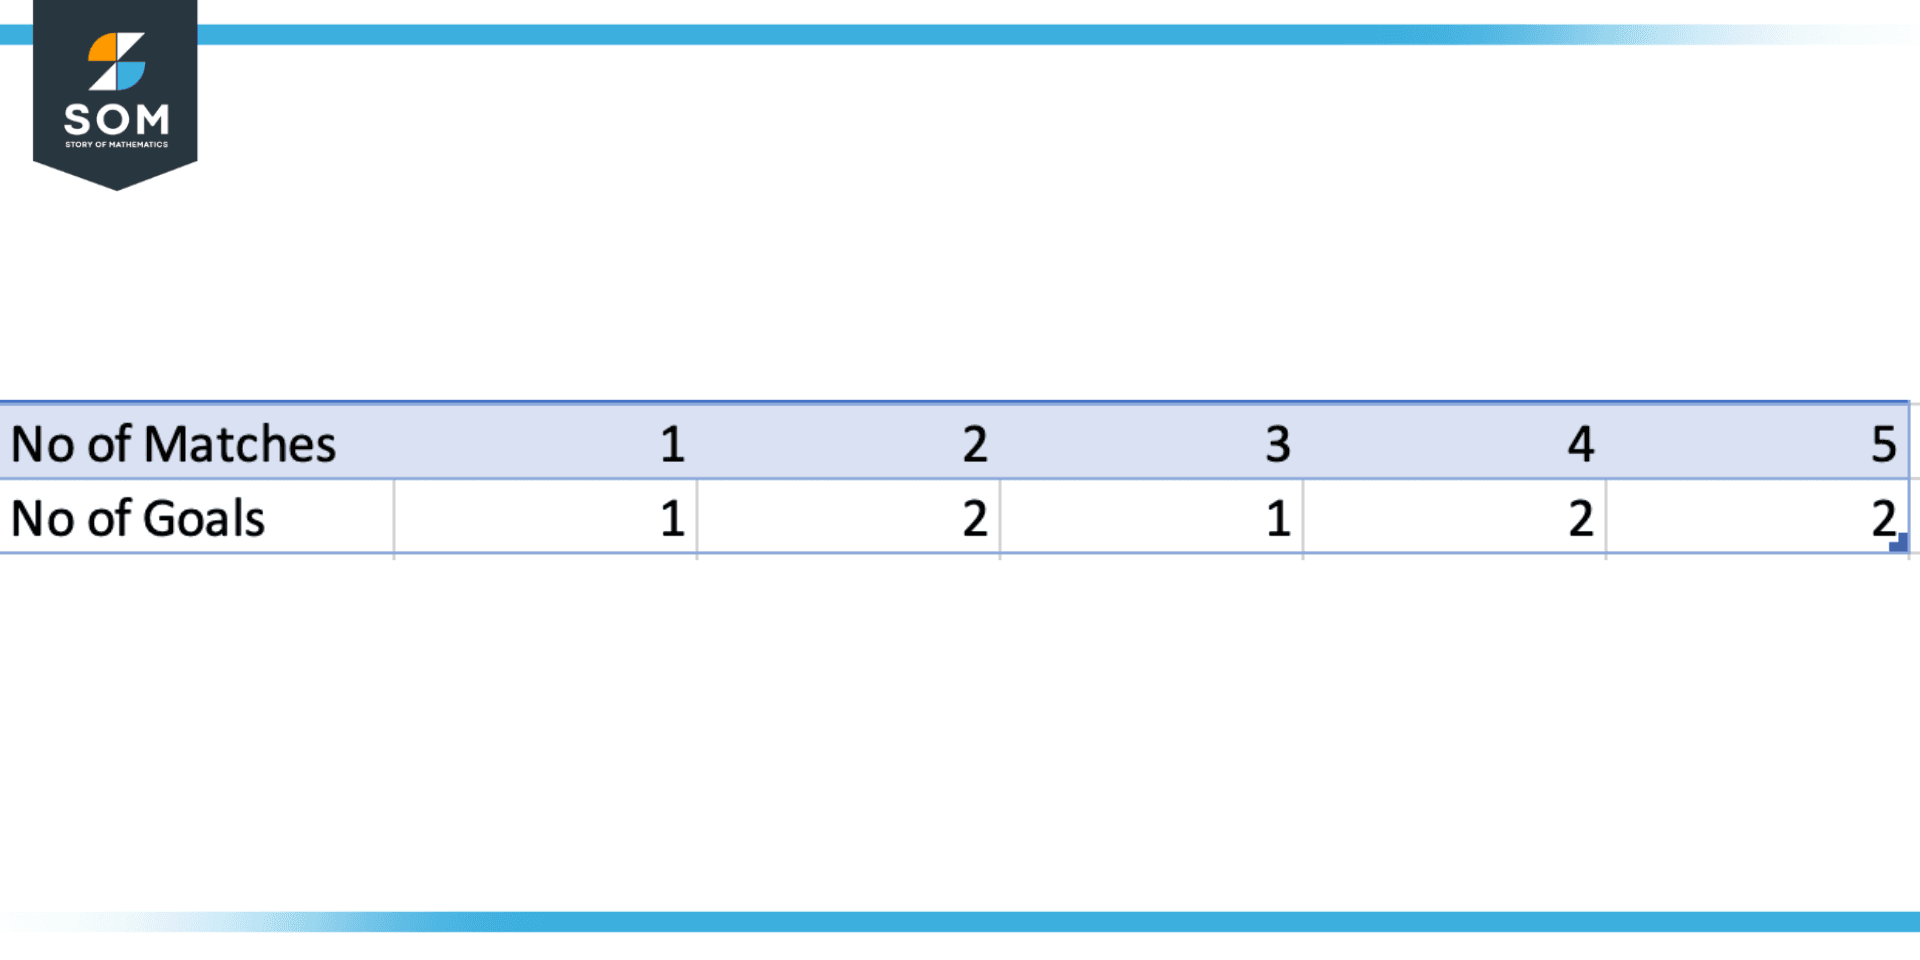
Figure 1 – Conceptual Overview of Mode
As a general rule, we represent data in statistics by a representative value that describes the whole collection in a rough sense. The measure of central tendency refers to this representative value. According to its name, it is a value that is the basis for analyzing data.
In this way, we can create a statistical summary of a large amount of organized data by using measures of central tendency. The mode of data can be used to measure central tendency.
For instance, talking about a football match, suppose there are 5 football matches and a player named Ronaldo scores 1 goal in the first match, 2 goals in the second match, 1 goal in the third match, and 2 goals in the third and fourth match.
We can see the data is kind of rough and we can’t build an argument based on this data so what we do is we will make a tabular form and use the concept of mode to build the conclusion or argument about the data as illustrated above, we can see the number of frequency of scoring two goals is greater than rest of all goal so we can conclude that, Ronaldo scores 2 goals frequently.
Generic Procedure for Finding Mode
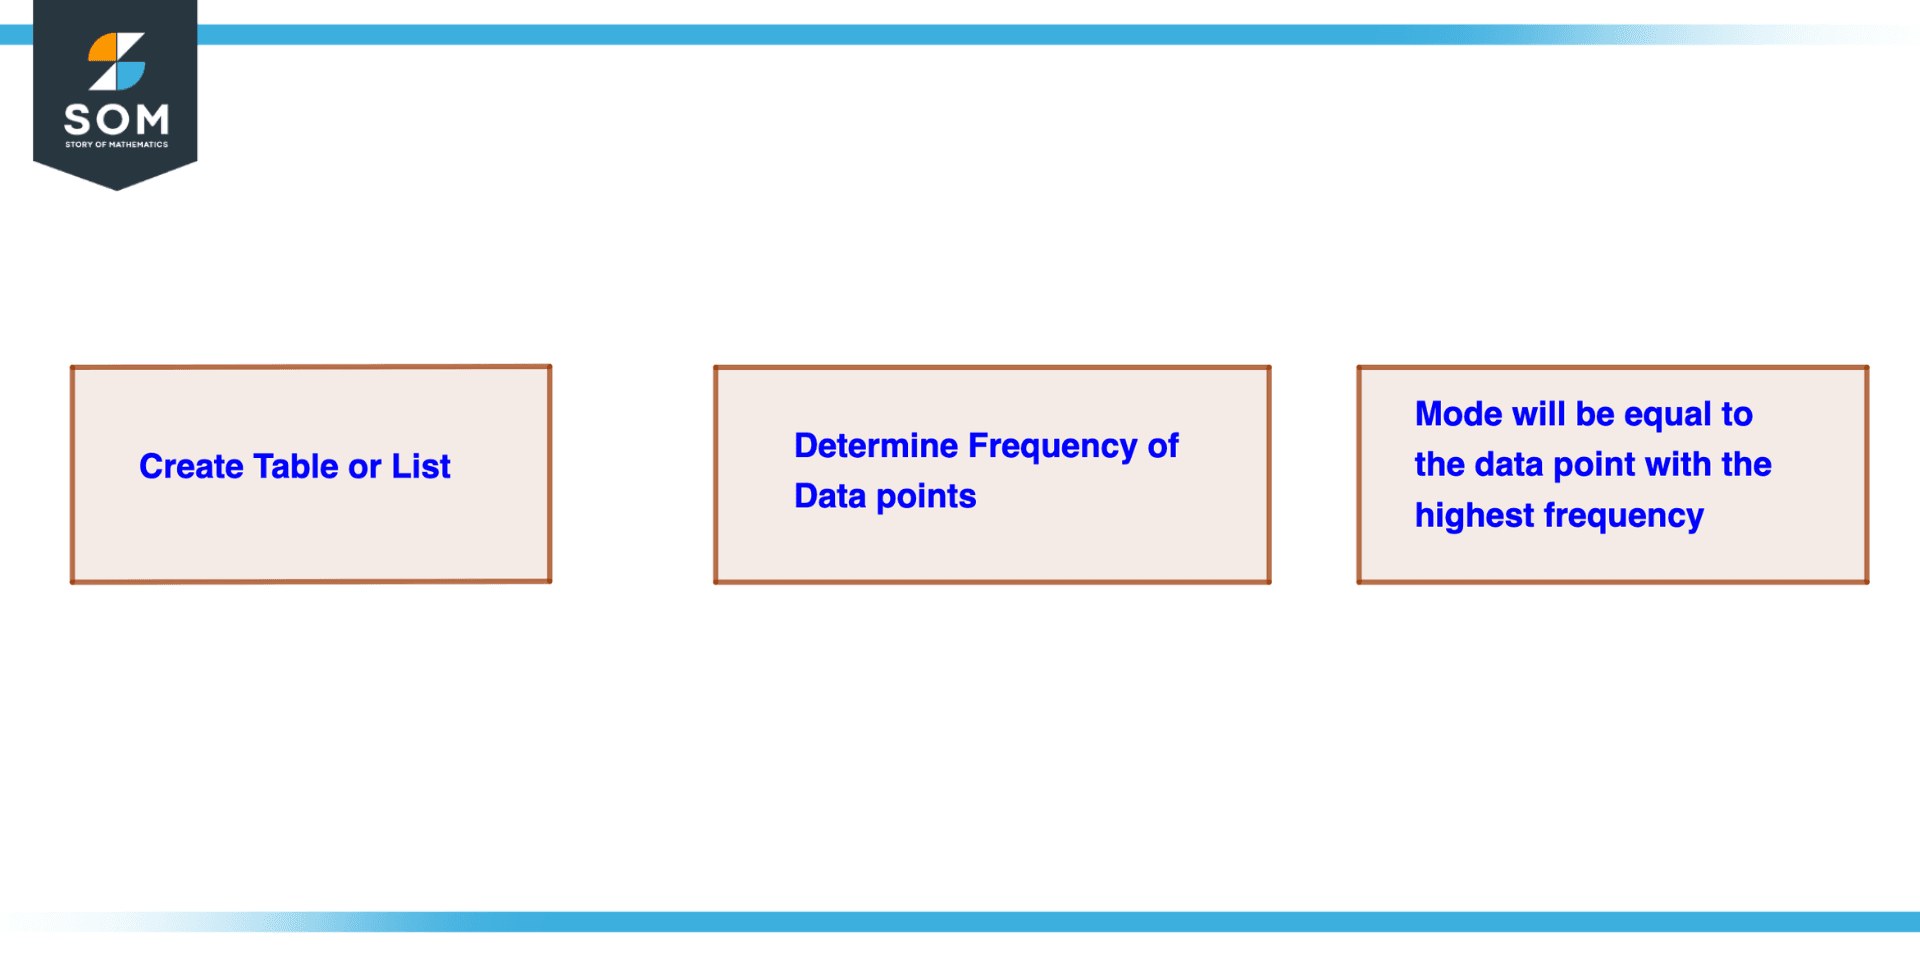
Figure 2 -Procedure For Finding Mode
To find the mode of a dataset, you can follow these steps:
- A list or table should be created with each data point listed separately.
- Analyze each data point to determine its frequency. A dataset’s frequency is the number of times a particular data point appears.
- Identify the data point or points that occur most frequently. These are the modes of the dataset.
Mode Vs. Median Vs. Mean
Mean
A dataset’s mean is determined by adding together all of its values and dividing by the total number of values in the dataset. When the data is continuous and there are no outliers, the mean provides a helpful indicator of central tendency (extreme values).
Median
In a dataset that has been sorted in numerical order, the median is the midway value. Given that it is unaffected by extreme values, the median is a good indicator of central tendency when the data is skewed or contains outliers.
Mode
The value that appears most frequently in a dataset is the mode. When the data is categorical or ordinal, the mode is a valuable indicator of central tendency (meaning it can be ranked or ordered).
The Formula for Finding Mode
Ungrouped Data
To find the mode for ungrouped data, you can use the following formula:
Mode = value that occurs most frequently
This means that you simply need to count the number of times each value appears in the dataset, and choose the value that appears most often.
Grouped Data
Mode = $\dfrac{\Sigma F \times \text{Midpoint}}{ \Sigma F}$
Where:
- F is the frequency of each group.
- Midpoint is the midpoint of each group, calculated as:
\[\dfrac{\text{Lower bound of the group} + \text{Width of the group}}{2}\]
Relationship Between Mean, Median, and Mode
The relationship between the mode, median, and mean can be summarized as follows:
- The dataset is symmetrical if the mode and median are identical, and the mean is identical to the mode and median as well.
- The dataset is skewed if the mode and median are not the same. The dataset is skewed to the right if the mode is higher than the median (positively skewed). The dataset is skewed to the left if the mode is less than the median (negatively skewed). In this instance, the mean might or might not be the same as the mode and median.
Finding Mode Using Mean and Median
Using Mean
The result that is most similar to the dataset’s mean is the mode. The dataset’s mean can be determined first, and the value that is most similar to the mean can then be used to determine the mode using this formula.
Using Median
The mode is the value that is closest to the median of the dataset. By calculating the dataset’s median value and then selecting the value that is most similar to the median, you can use this formula to determine the mode.
Properties of Mode
There are a few key properties of the mode that are worth noting:
- Extreme values do not have an impact on the mode (also known as outliers).
- Sometimes the mode is not particular. There are two possible modes for a dataset: many modes and no modes at all.
- For datasets that are skewed or contain a significant number of outliers, the mode is not always a reliable indicator of central tendency.
- For datasets with a lot of unique values, the mode is not always a good indicator of central tendency.
Generally speaking, the mode is most helpful when the data is categorical or ordinal (meaning it can be ranked or ordered). Because it represents the most frequent value or category in the dataset, the mode can be a helpful indicator of central tendency in certain circumstances.
When the data is continuous or has a large number of distinct values, the mode may not be as helpful because it may not truly reflect the data’s general distribution.
Solved Example Problems of Mode
Example 1
Consider the following dataset: 2, 4, 6, 8, 10, 10, 12, 14, 16, and 18. Find the mode of the dataset.
Solution
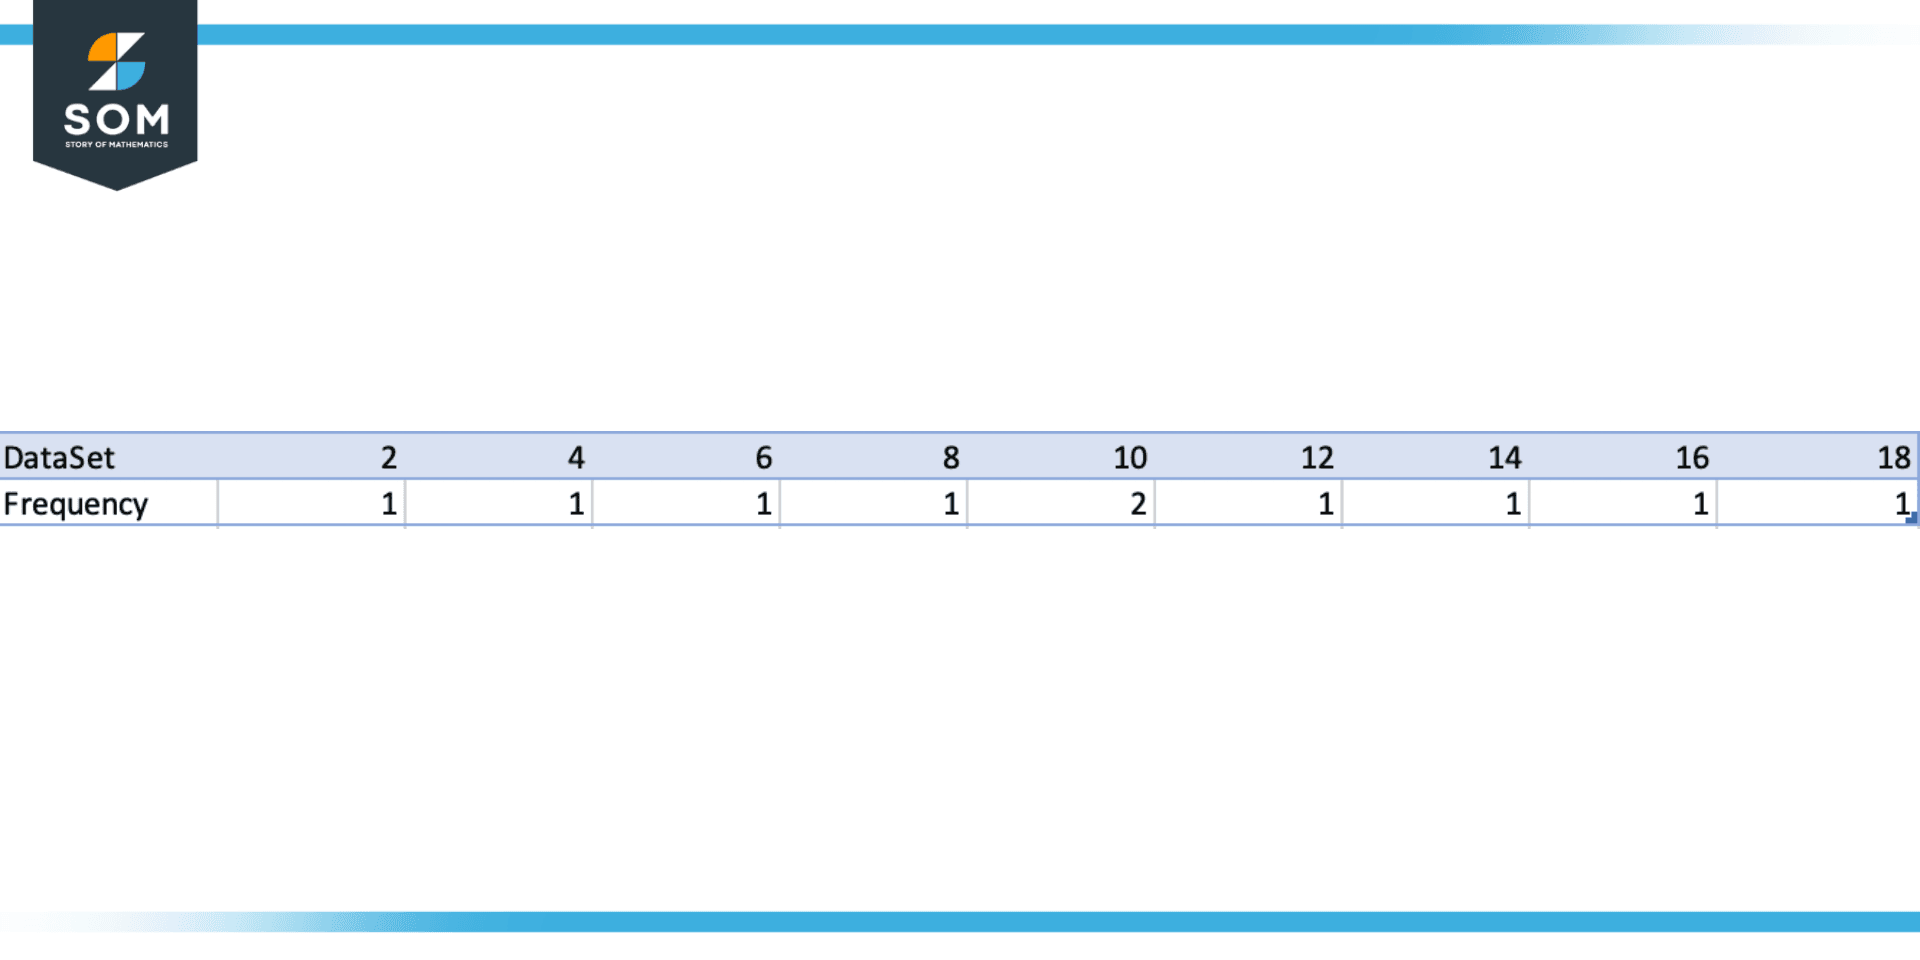
Figure 3 – Example of the mode of ungrouped data
To find the mode of this dataset, we can count the number of times each value appears.
In this dataset, the data point “10” occurs most frequently, with a frequency of 2. While the rest of the data points occurred only one time having a frequency equal to 1. Therefore, the mode of this dataset is 10.
Example 2
For example, consider the following grouped data having four groups. The frequency and midpoint of each group are shown in the table below.
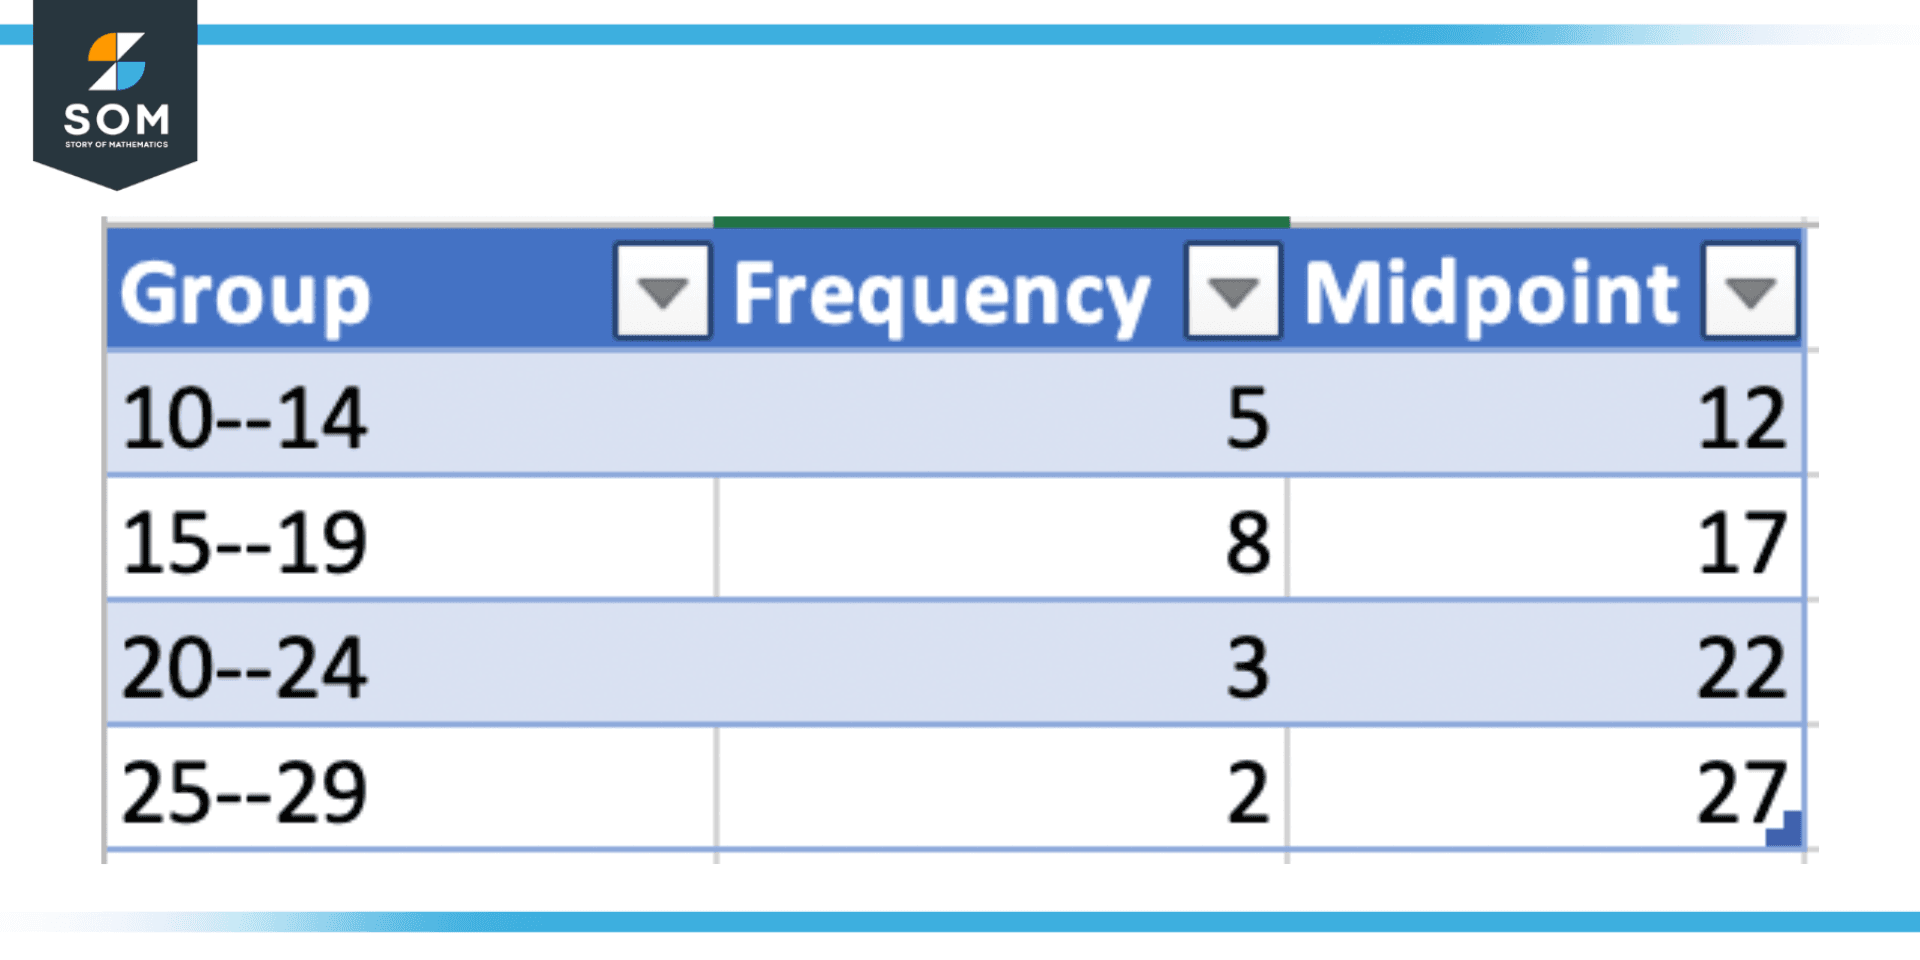
Figure 4 – Example of the mode of grouped data
Solution
To find the mode for this dataset using the formula, we can follow these steps:
- Calculate the midpoint for each group: 12, 17, 22, and 27.
- Multiply the frequency for each group by the midpoint to obtain the weighted midpoint: 60, 136, 66, and 54.
- Add up all the frequencies: 5 + 8 + 3 + 2 = 18.
- Add up all the weighted midpoints: 60 + 136 + 66 + 54 = 316.
- Plug the values into the formula: mode = (316 / 18) = 17.6.
- In this example, the mode is 17.6. This means that the value that occurs most frequently in the dataset is around 17.6.
When a dataset contains categorical or ordinal data, the mode can be useful for spotting patterns or trends. Additionally, finding the most frequent value in a dataset can be useful for making judgments or predictions.
All mathematical drawings and images were created with GeoGebra.