JUMP TO TOPIC
In other words, we can say that an outcome is the acquired output from performing an experiment.
Conceptual Overview
Before we dig deeper into the term outcome we have to refine our concept related to probability so we will revisit some terms as described below. The illustration of the outcome of tossing a fair coin is shown in the figure.
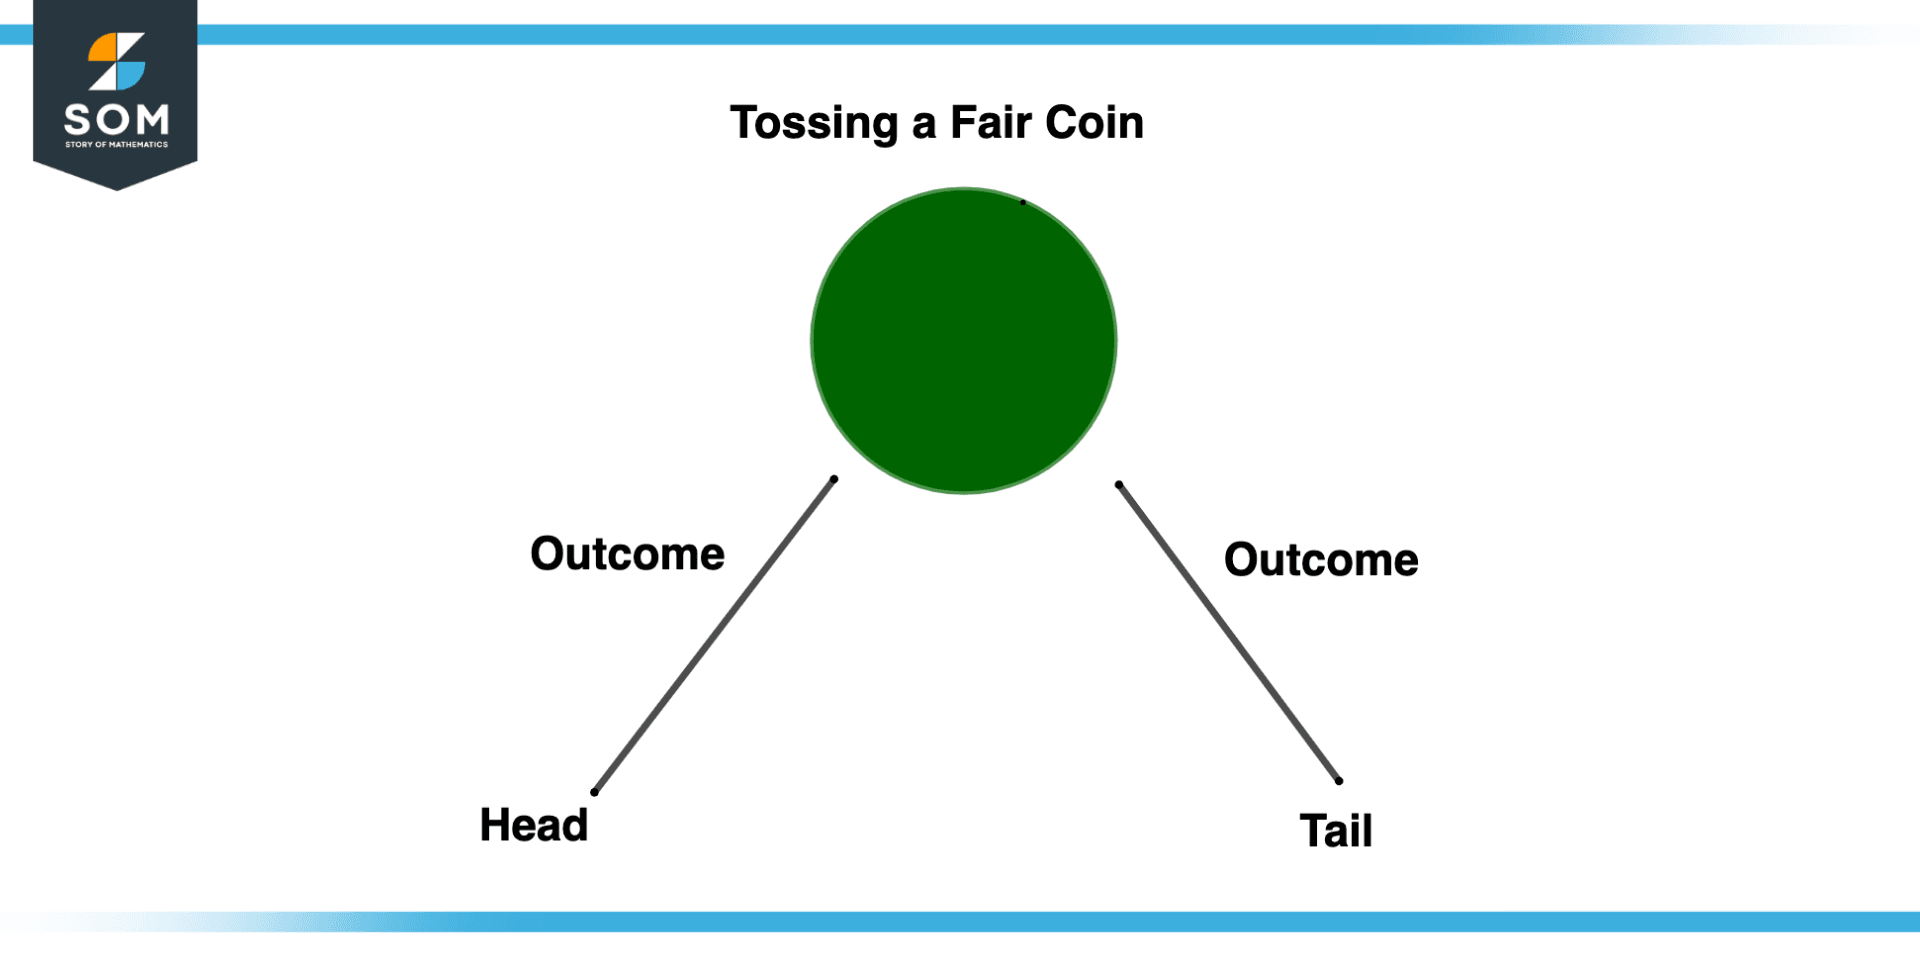
Figure 1 – Outcome of Tossing a Fair Coin
Experiment
When a set of actions is performed to produce an operation that contains outcomes that are not certain. For instance, rolling the die, tossing a coin, and many more.
Sample Space
Suppose we have done a simple experiment and we get an outcome and on repeating up to n possible time, all the outcomes are represented in a space known as sample space that has all the outcomes of the experiment.
For instance, suppose we roll a die. Whatever number comes facing up is an outcome of this experiment. However, a die has six faces, and each face has a unique number associated with it as 1, 2, 3, 4, 5, and 6. So the total set of possible outcomes for each experiment is the sample space S = {1, 2, 3, 4, 5, 6}. The “{}” emphasize the sample space’s set-like nature.
Event
When an experiment is performed then the outcomes of that experiment are known as an event, in other words, the specific set of outcomes when an experiment is performed. For instance, if a die is rolled the sample space will be S={1,2,3,4,5,6} but the event may be defined as E={2,4,6} set of even number outcomes, or E={1,3,5} which is a number is odd, so this represents the event.
Elementary Event
An event that has a single outcome is known as an elementary event. For instance, tossing a coin and getting a head.
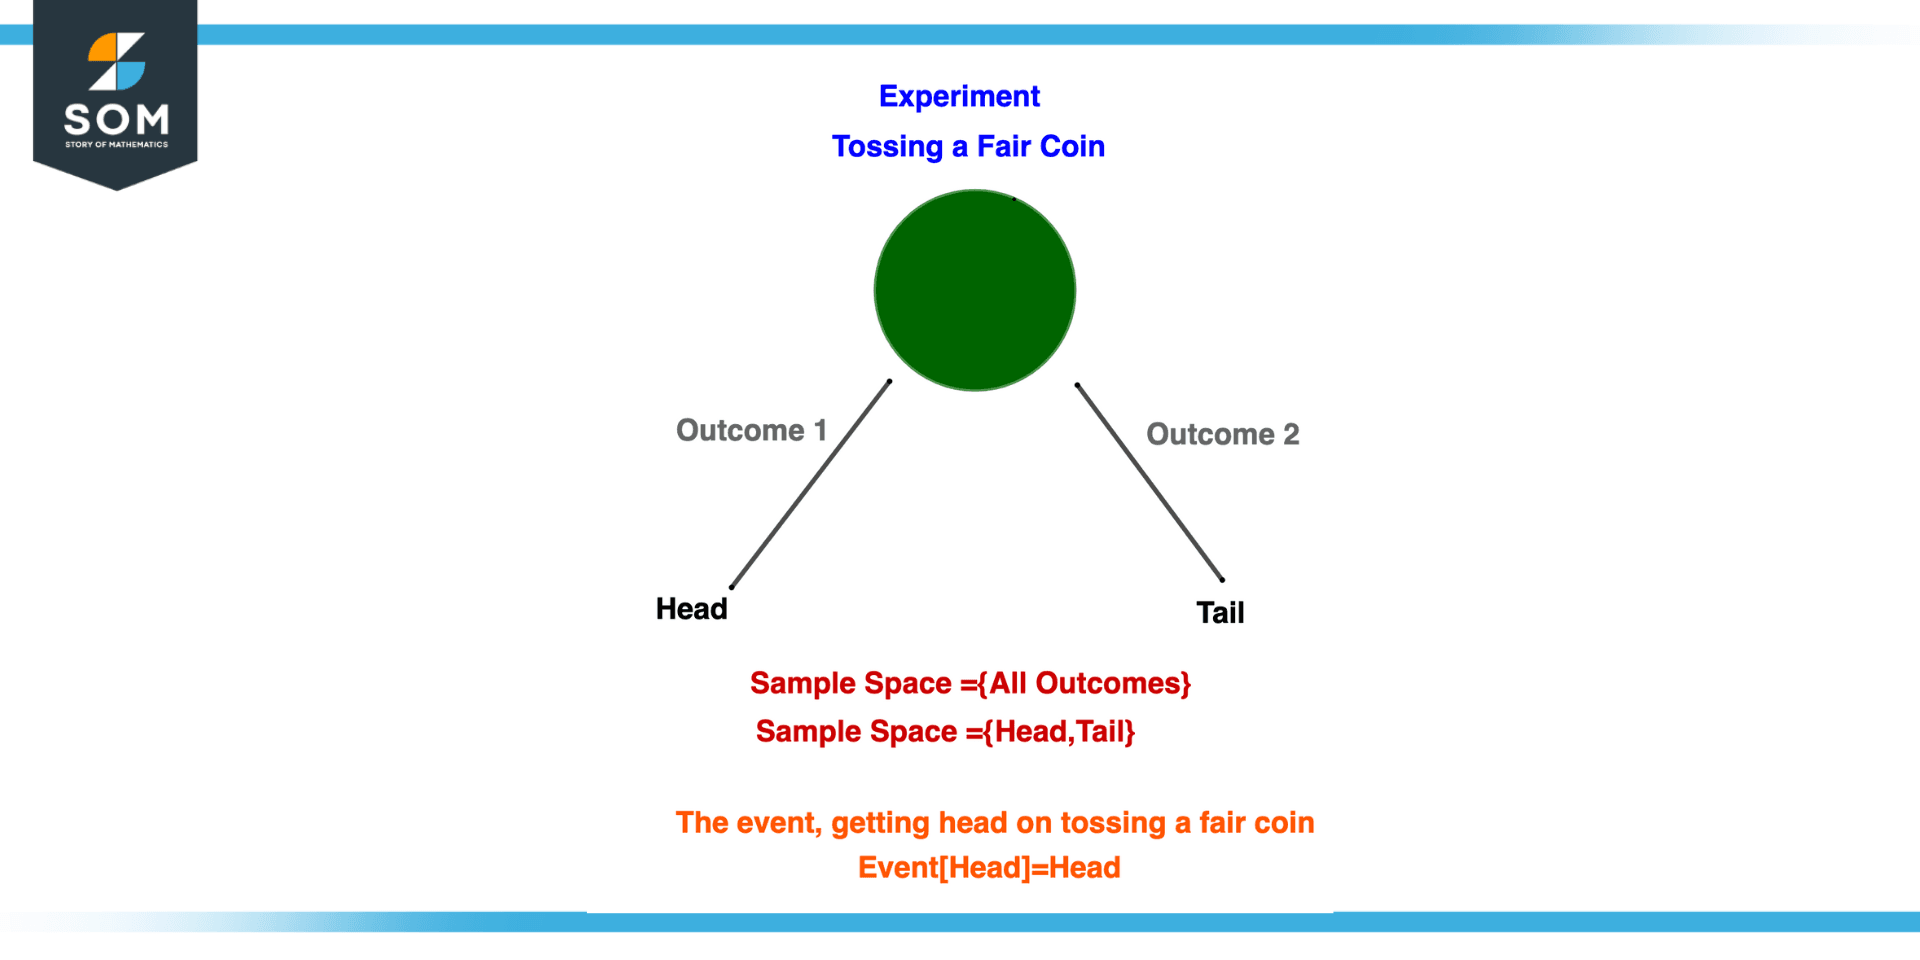
Figure 2 – Conceptual Overview of Outcome of Experiment
Illustration of Outcomes in Various Experiments
Experiment 1
Suppose we perform an experiment in which we toss a coin two times. Then the possible outcomes will be four. Making sample space for this experiment gives S={(H, T), (T, T), (T, H), (H, H)} Where H and T represent head and tail respectively.
In order to not mix the event and outcome terms, we will describe a small difference where events are a subset of the sample space like an event having “two heads when a coin is tossed two times”. So this event will be equal to E=(H, H) while the outcome can be calculated by $2^{n}$ where n is the frequency of operation.
In this experiment, a coin is tossed two times, so the frequency is 2. Since $2^{2}=4$, there are four possible outcomes. This illustration is shown below.
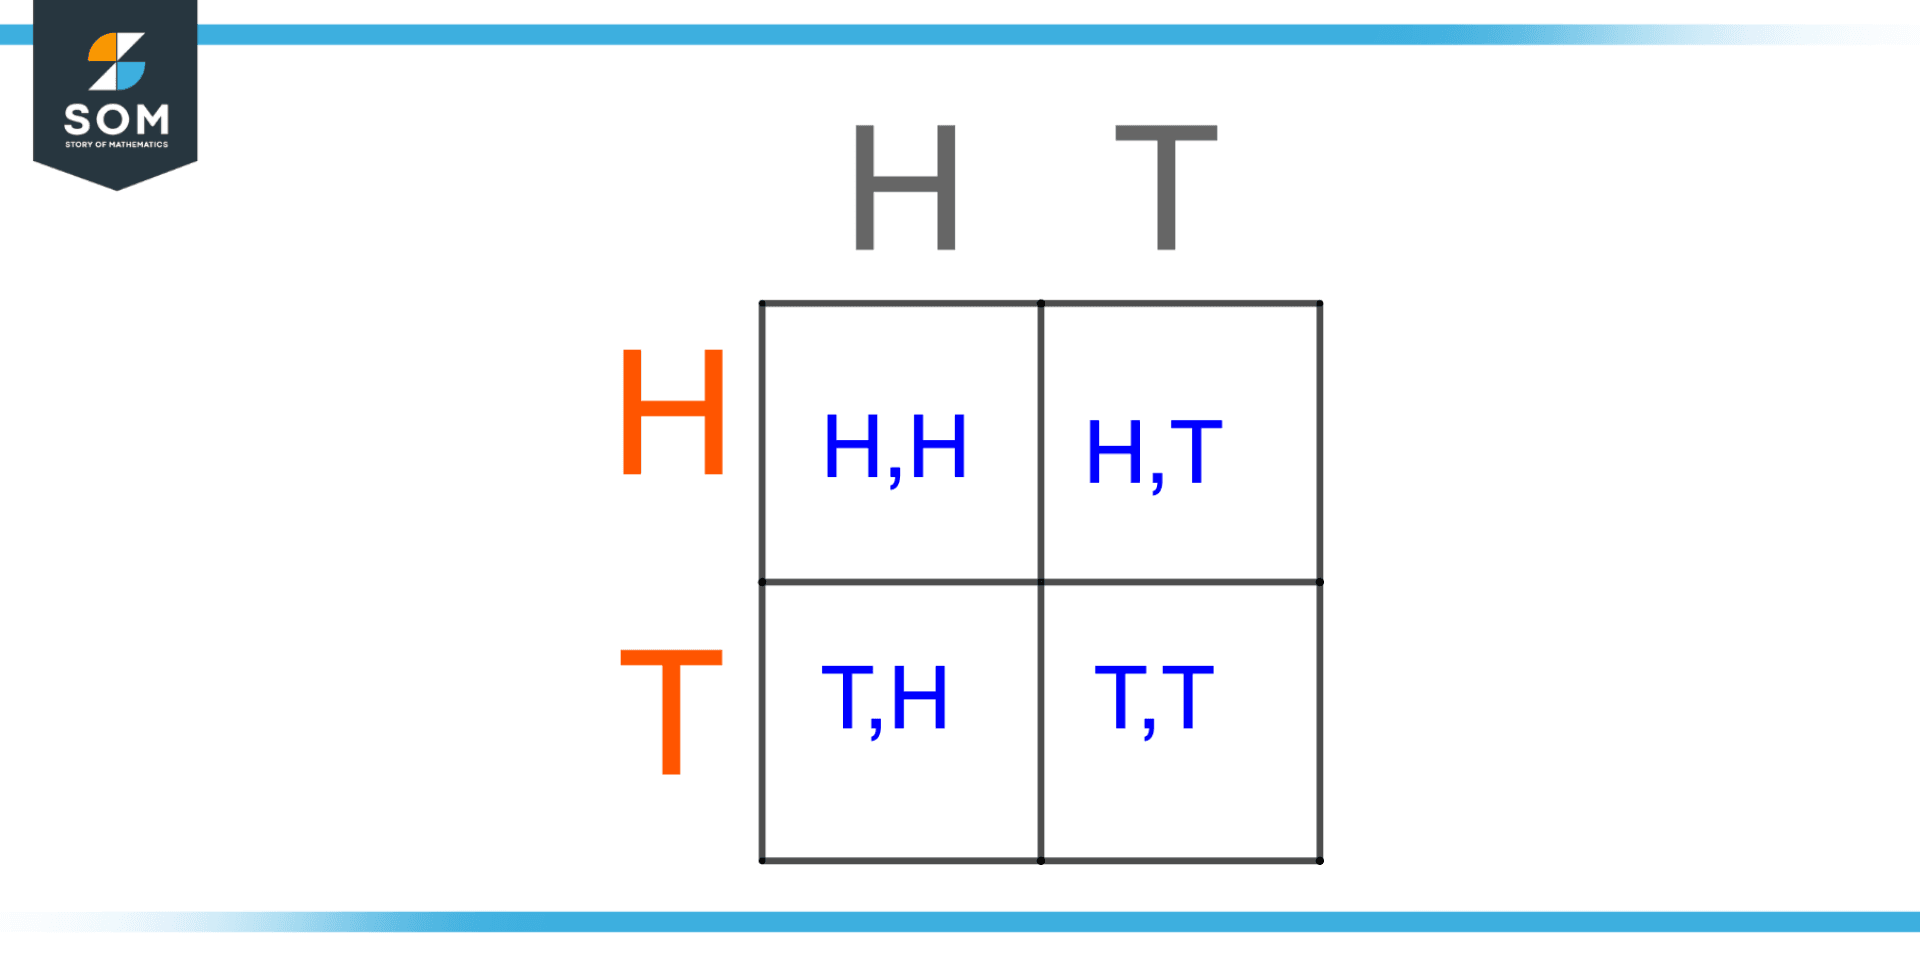
Figure 3 – Illustration of tossing a coin two time
Experiment 2
Suppose we have two dice and we roll them as we know the outcome for one dice is 6 so for two dice there will be 6 x 6 = 36 outcomes, we can define an event here as the outcomes having the sum greater than 3. This illustration is shown in the figure below.
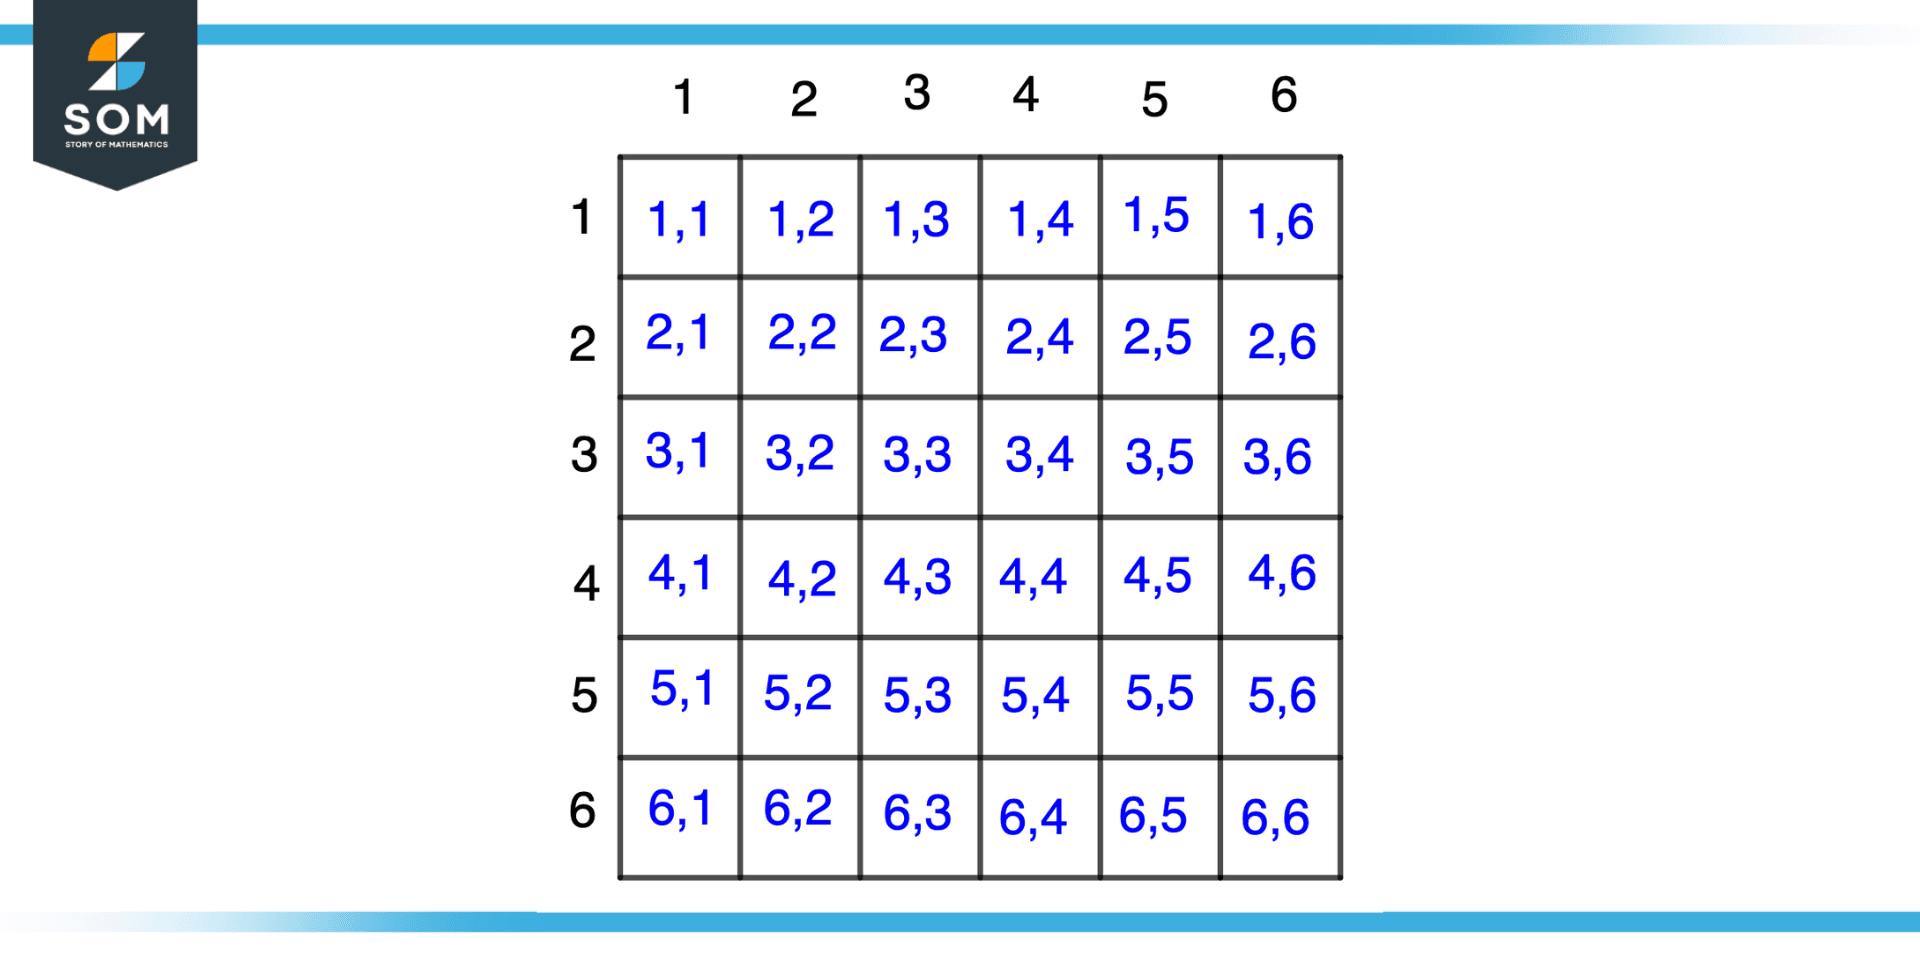
Figure 4 – Illustration of rolling a dice twice and checking outcomes
Outcome Probability
Discrete Domain
For a deterministic domain where is no infinite sample space, the probability of each outcome can be easily assigned according to the given sample space.
For example, when a fair die is rolled once, the sample space is {1,2,3,4,5,6}, and we can write the probability of individual outcomes as below.
P(X) = No. of Favourable Outcomes / Total No. of Outcomes
probability that the number 1 faces up = P(1) = 1/6
probability that the number 2 faces up = P(2) = 1/6
And similarly, we get the same probabilities for the rest of the outcomes:
P(3) = 1/6
P(4) = 1/6
P(5) = 1/6
P(6) = 1/6
It is possible for outcomes to have different probabilities of occurrence, such as one side of the die being heavier than the rest, etc. Experiments with such biased devices are called biased experiments.
Continuous Domain
When we are talking in the continuous domain where our sample space is generally infinite then the probability for each outcome will be zero because in this domain we assign probability in piecewise ranges as shown below. The region has two outcomes X>0.5 and X<0.5 so we assign a probability of 0.5 to one region and 0.5 to another region sums up giving the probability of 1.
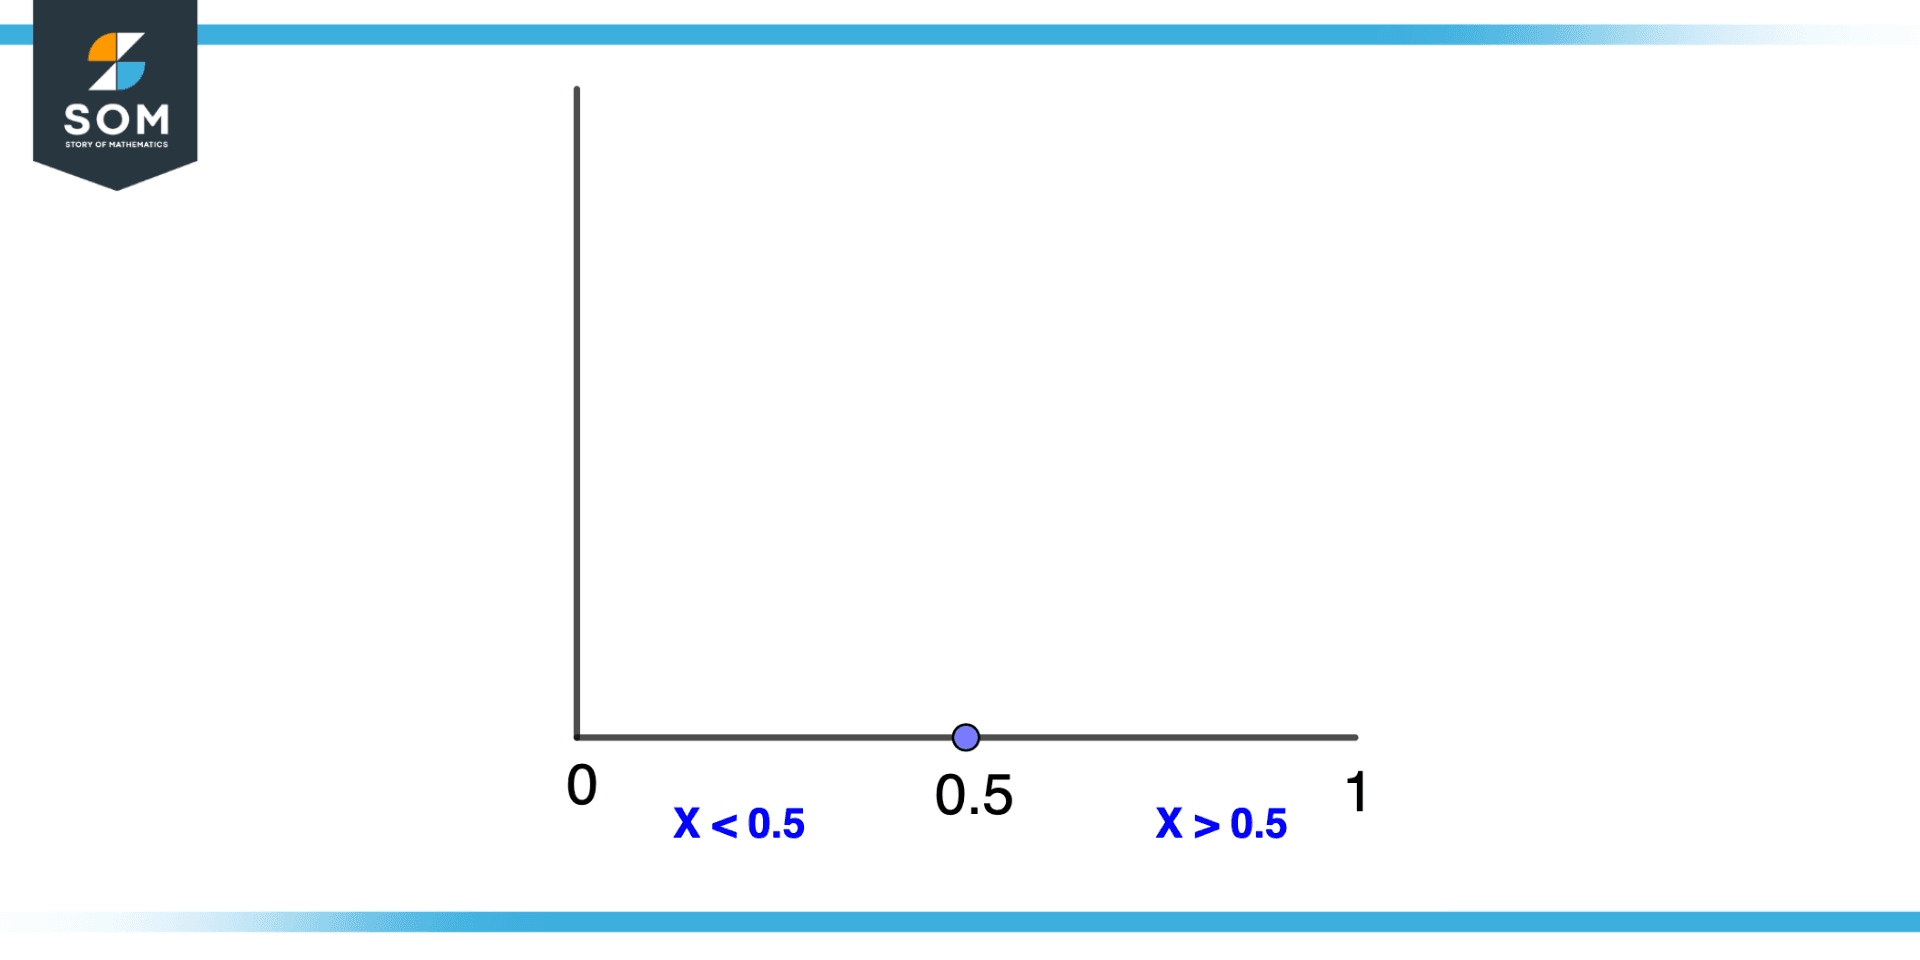
Figure 5 – Outcome in Continuous Domain
Equally Likely Outcomes
The probability of each outcome in the space is equal, so we can assume all outcomes are equally likely (assume they occur at equal rates).
An ordinary coin, for instance, is assumed to have the same probability of landing “head” or “tail”. Common games of chance use randomization tools based on the assumption that all outcomes have an equal probability.
Various probabilities are sometimes treated as if they are all equally likely, which is not the case. A set of equally likely outcomes can’t be used to describe all experiments. For instance, throwing a thumbtack and watching whether it lands upward or downward doesn’t imply that both outcomes are equally likely.
Tree Diagram
In probability, a tree diagram helps to determine the potential outcomes or likelihoods of an event along with the information that whether the event occurred or not. Below is the illustration of the tree diagram where a coin is tossed and the probability of each outcome is shown below. We can see that the sample space is S={Head, Tail} and the probability of each outcome is 0.5.
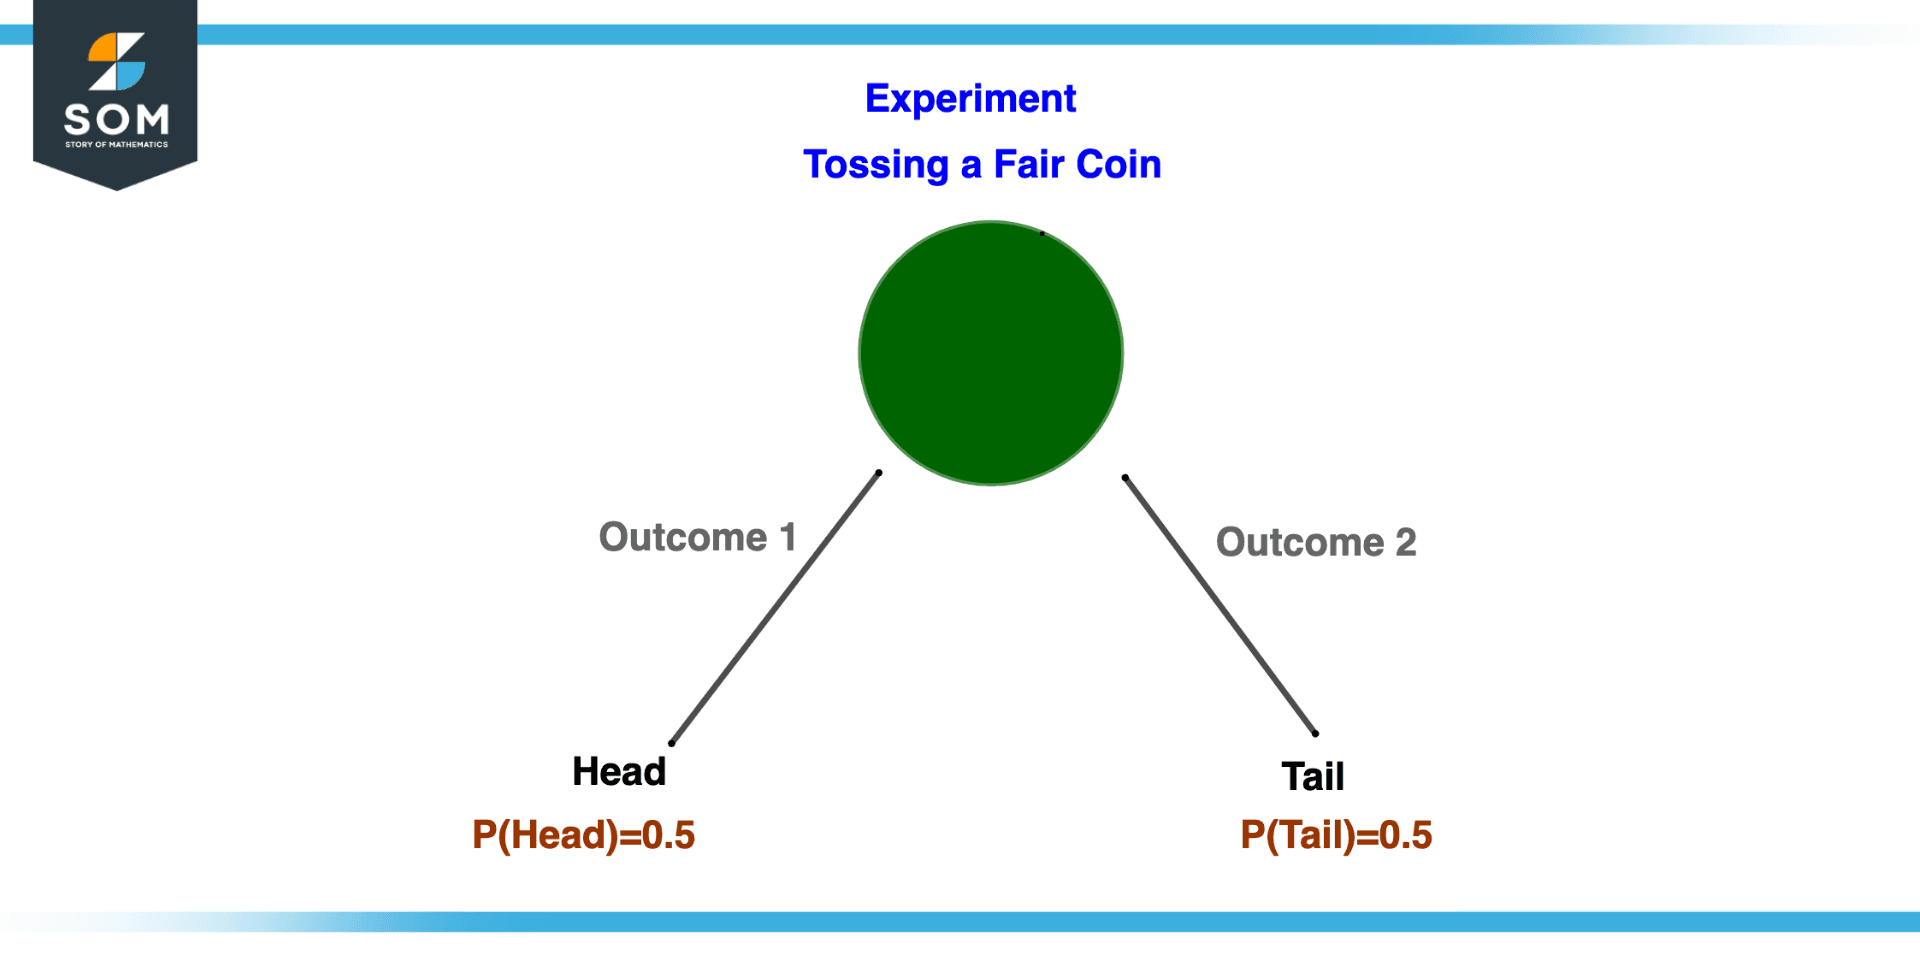
Figure 6 – Tree Diagram for Probability of an outcome
Example Problem – Determining Outcomes of an Experiment
For the given experiment, determine each experiment’s outcomes and sample space.
Experiment 1: Select a ball from a bag containing balls numbered 1 to 20 and note the number of balls.
Experiment 2: Tossing a coin three times and noting the order of head and tail.
Experiment 3: Tossing a coin three times and noting the number of heads.
Experiment 4: Suppose we have a bag containing two red balls numbered 1,2 and two blue balls numbered 3,4 color, and the number of balls is noted.
Solution
Experiment 1
The outcome will be any ball numbered from 1 to 20.
Sample space will be all the outcomes from 1 to 20 so:
S={1, 2, 3, …, 20}.
Experiment 2
The outcome will be any sequence from HHH, HHT, HTH, THH, THT, THH, TTH, and TTT.
Sample space will be all the outcomes:
S={HHH, HHT, HTH, THH, THT, THH, TTH, TTT}.
Experiment 3
The outcome will be any number of heads from 0,1, 2, 3.
Sample space will be all the outcomes:
S={0, 1, 2, 3}
Experiment 4
The outcome will be any sequence from (1, R), (2, R), (3, B), (4, B).
Sample space will be all the outcomes:
S={(1, R), (2, R), (3, B), (4, B)}
All mathematical drawings and images were created with GeoGebra.