JUMP TO TOPIC
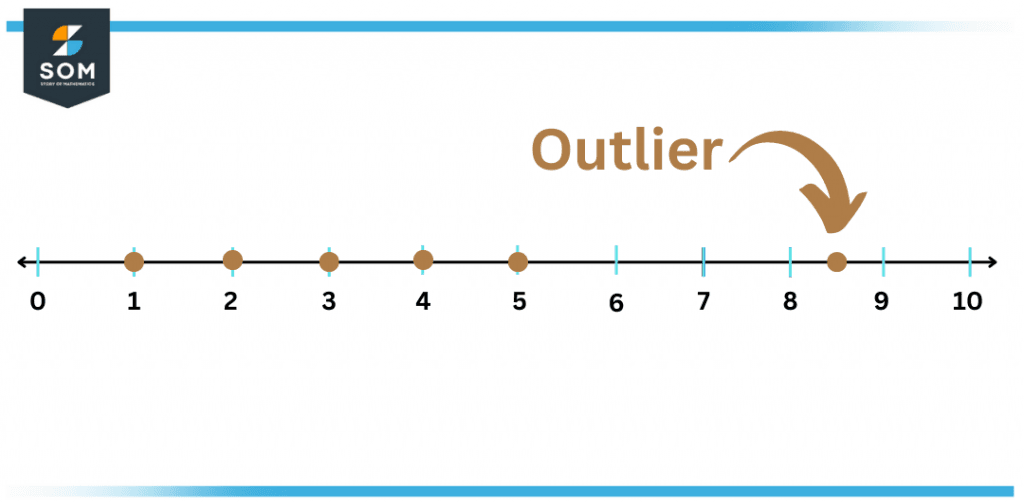
Figure 1 – Outlier on a Number line
Most of the time, the data points that are farther away from the rest are omitted from the set. Another reason can be because of an experimental or human error which may result in a significant drift.
Not every outlier is supposed to be causing a serious problem in your experimental analysis, but neither does every outlier can be a hint for an exhilarating opportunity.
Defining an Outlier
In any distribution, outliers might happen by chance. However, they can also signal measurement errors, abnormal conditions or structures in the data set, or a heavily loaded propagation in the population.
Far more often, in extremely large data collections, certain data points will be significantly distant from the mean of the distribution compared to what is regarded as fair.
It can be because some observations are distant from the middle of the spectrum, unintentional periodic faults, or problems with the concept that formed the hypothesized group of stochastic processes.
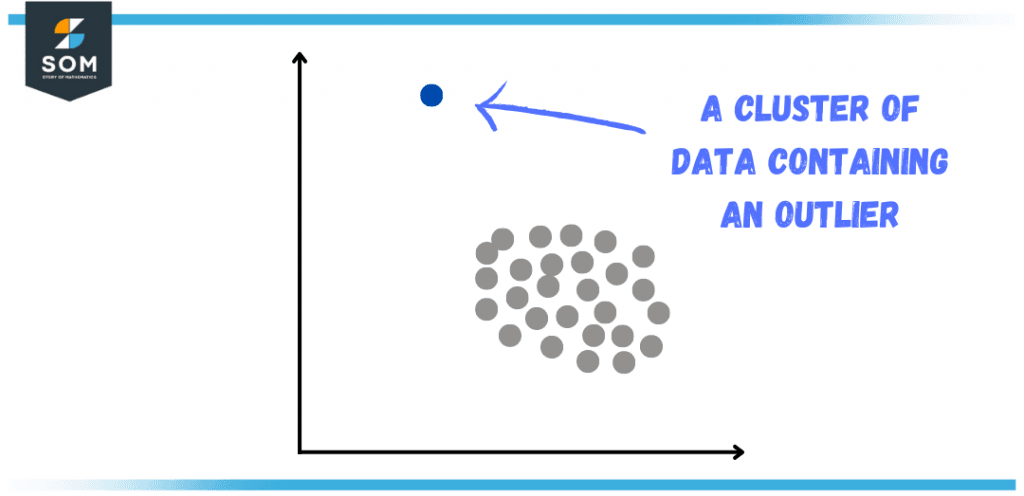
Figure 2 – Outlier in a Dataset
Consequently, outlier values may hint at inaccurate information, improper methodology, or regions in which a particular concept may not necessarily apply. Nevertheless, it is common to anticipate a few outliers in big datasets.
What Is a Data Set?
An assortment of data is referred to as a dataset. Usually, this collection is shown in a tabulated form. A specific parameter is described in each section. Moreover, depending on the proposed issue, each array refers to a certain element of the information set. Data management includes this.
The values of every parameter for uncertain things, such as the size, mass, warmth, density, etc., of an item or the values of different numbers, are described in data sets.
The data set comprises information from one or perhaps more participants for each array. Now let us discover the concept of a dataset, multiple dataset kinds, characteristics, and more.
Depending upon the nature of the environment, data sets can have several types, but let’s look into some of the most common ones used in machine learning and AI.
Numerical Sets
As the name suggests, data represented in the form of numbers instead of alphabetical letters is known as a numerical dataset. The weight of a human body or the length of a boat are examples of numerical datasets on which arithmetic operations can be performed.
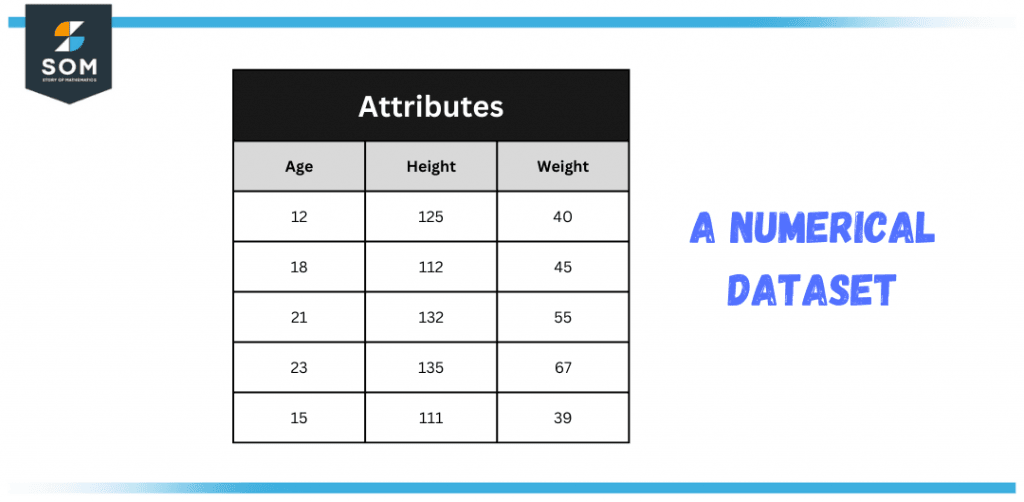
Figure 3 – A Numerical Dataset
Bivariate Set
A bivariate set consists of two parameters in a data set. This group of data addresses the connection between those two parameters. Usually, two types of related data are typically present.
For instance, to determine a soccer team’s player age and goal percentage. Age and goals scored are two criteria that can be addressed.
Categorical Sets
Value or attribute sets for people or things are represented by categorical sets of data. Polytomous values are categorical parameters or variables that have more than two possible quantities. The gender status of a human being is a solid example of categorical sets.
How Can an Outlier Be Recognized?
There are certain ways to recognize or identify an outlier, but we will look into the mathematical methods to find an outlier from a given numerical data set.
An outlier can be of two types, a lower outlier, and a higher outlier, and both of these outliers can be found if they fulfill the following requirements:
outlier < First Quartile – 1.5 x (Inter-Quartile Range)
outlier > Third Quartile + 1.5 x (Inter-Quartile Range)
The first requirement is for the lower outlier as the data point has to fulfill the requirement of being less than 1.5 times the interquartile range from the first quartile.
Similarly, the second requirement is for the higher outlier as the data point has to fulfill the requirement of being greater than 1.5 times the interquartile range from the third quartile.
But first, we have to find the Q1, Q2, and IQR, which will be explained in the example.
How To Handle the Outlier?
Depending on the circumstance, one should decide how to cater to an outlier. Here are a few methods that will help you to retain or eliminate your outlier from the data set.
Preservation
Outliers really shouldn’t be immediately ignored even though a parametric statistical model would be suitable for the variables getting examined because they are predicted for large amounts of data. The system should characterize data with circulating outlier values using machine learning techniques that are resilient to misfits.
Dismissal
Dismissal of an outlier is not considered a good practice among the scientific community as well as the educators who teach such subjects. From the mathematical perspective, there are certain quantitative ways in which flawed data can be dismissed.
Dismissal or exclusion of an outlier is better practiced in areas where there is a known chance of an error in the measurement or if there lies an instrumental fault causing the exclusion of an outlier.
Irregular Distributions
Take into account that perhaps the data‘s regression line or distribution might not have normal behavior and could potentially have “ifs and buts.” A good example is a Cauchy distribution in which the variability of data points increases with the increase in sample size and thus throws the outliers as far as they can from the standard distribution.
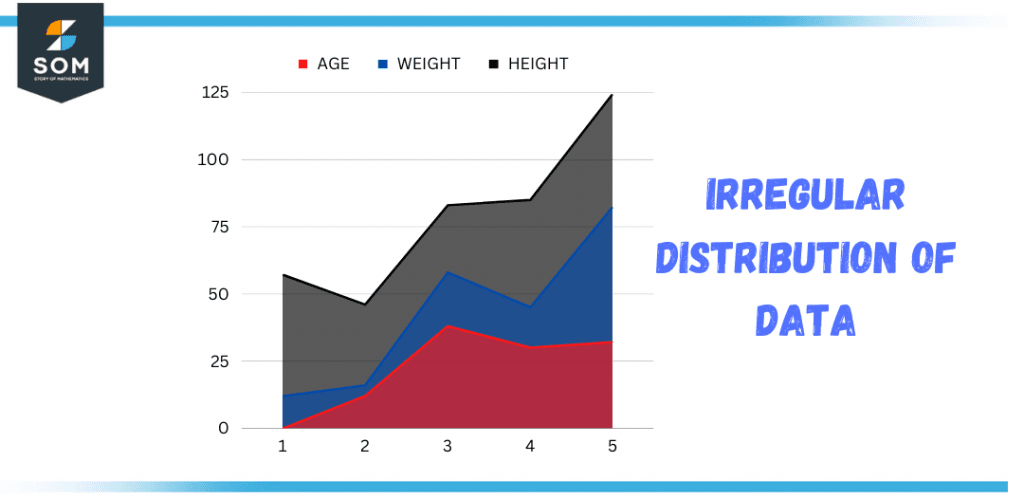
Figure 4 – Irregular Distributions of Data
Solved Example
Let’s take an odd distribution and find out the lower outlier and the upper outlier using the equations described above:
15, 16, 3, 5, 5, 34, 10, 11, 12, 4, 1
Solution
Arranging in ascending order:
1, 3, 4, 5, 5, 10, 11, 12, 15, 16, 34
Finding the Median
Next, we will calculate the median, which is 10, as it is in the middle. So Q2 = 10.
Calculating Q1
Q1 can be found by figuring out the median of the lower half of the data set. Thus the median of 1, 3, 4, 5, 5 is 4, which is the value of Q1.
Calculating Q1
Similarly, Q1 can be found by figuring out the median of the upper half of the data set. Thus the median of 11, 12, 15, 16, 34 is 15, which is the value of Q1.
Finding the Value of IQR
The interquartile range can be easily found by taking the difference between the upper quartile and the lower quartile:
IQR = Q1 – Q1
IQR = 15 – 4
IQR = 11
Finding an Outlier in the Dataset
As of now, we have the following information about the dataset:
Q1 = 4
Q2 = Med = 10
Q1 = 15
IQR = 11
Min = 2
Max = 34
So the outlier can be calculated as:
outlier < Q1 – 1.5 x (Inter-Quartile Range)
outlier < 4 – 1.5 x (11)
outlier < -12.5
Since there is no value less than -12.5, the lower outlier of the dataset doesn’t exist.
Now let’s find the other one:
outlier > Q1 + 1.5 x (IQR)
outlier > 15 + 1.5 x (11)
outlier > 31.5
If we peek inside the given dataset, we can find a number that is larger than 31.5, which is 34, so the upper outlier of the current dataset is 34.
By applying the same methods as above, you can find an outlier of an even dataset. The difference lies in the process of the median hunt, whereas the rest remains the same.
All images/mathematical drawings were created with GeoGebra.