JUMP TO TOPIC
A point may show the beginning of any line or object too. By connecting these points we can form any desired figure or object.
In the following figure, you can see points represented by alphabets.
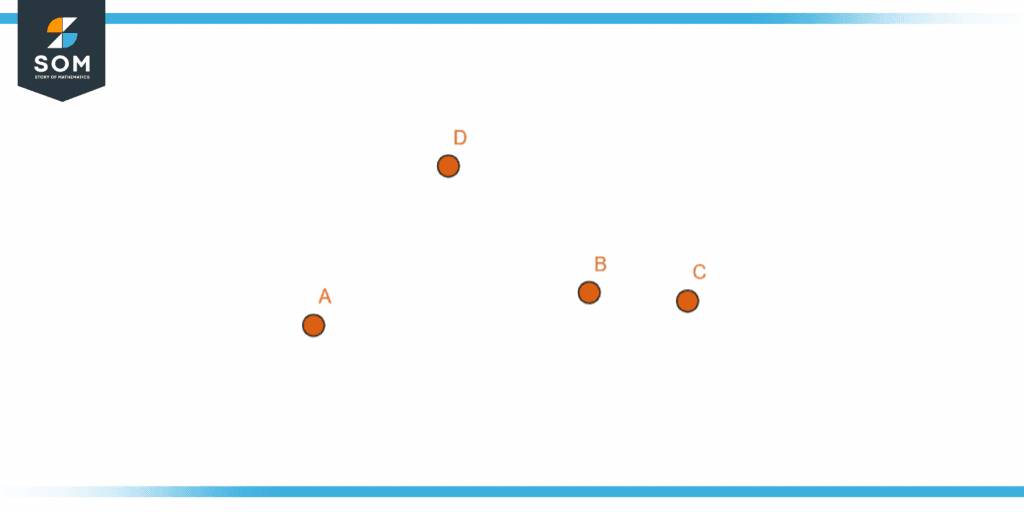
Figure 1 – Points in a plane
Theoretical Explanation
A point itself has no length, height, or size. It is a small dot that we use to help us in so many things. In a 3D plane, a point is represented by an ordered triplet which can be any 3 alphabets that define the exact location of the point. We usually use X, Y, and Z. Note that when a point is represented through any alphabet, then the alphabet is always in capital format.
Points are quite useful when it comes to geometry, this is because we can use these points to form any desired figure. For example, we can use points to form a circle on a plane. It may vary whether the circle has been formed by using 2 points or more. Similarly, all types of shapes can be formed by using points. The following example shows some figures drawn with their respective points.
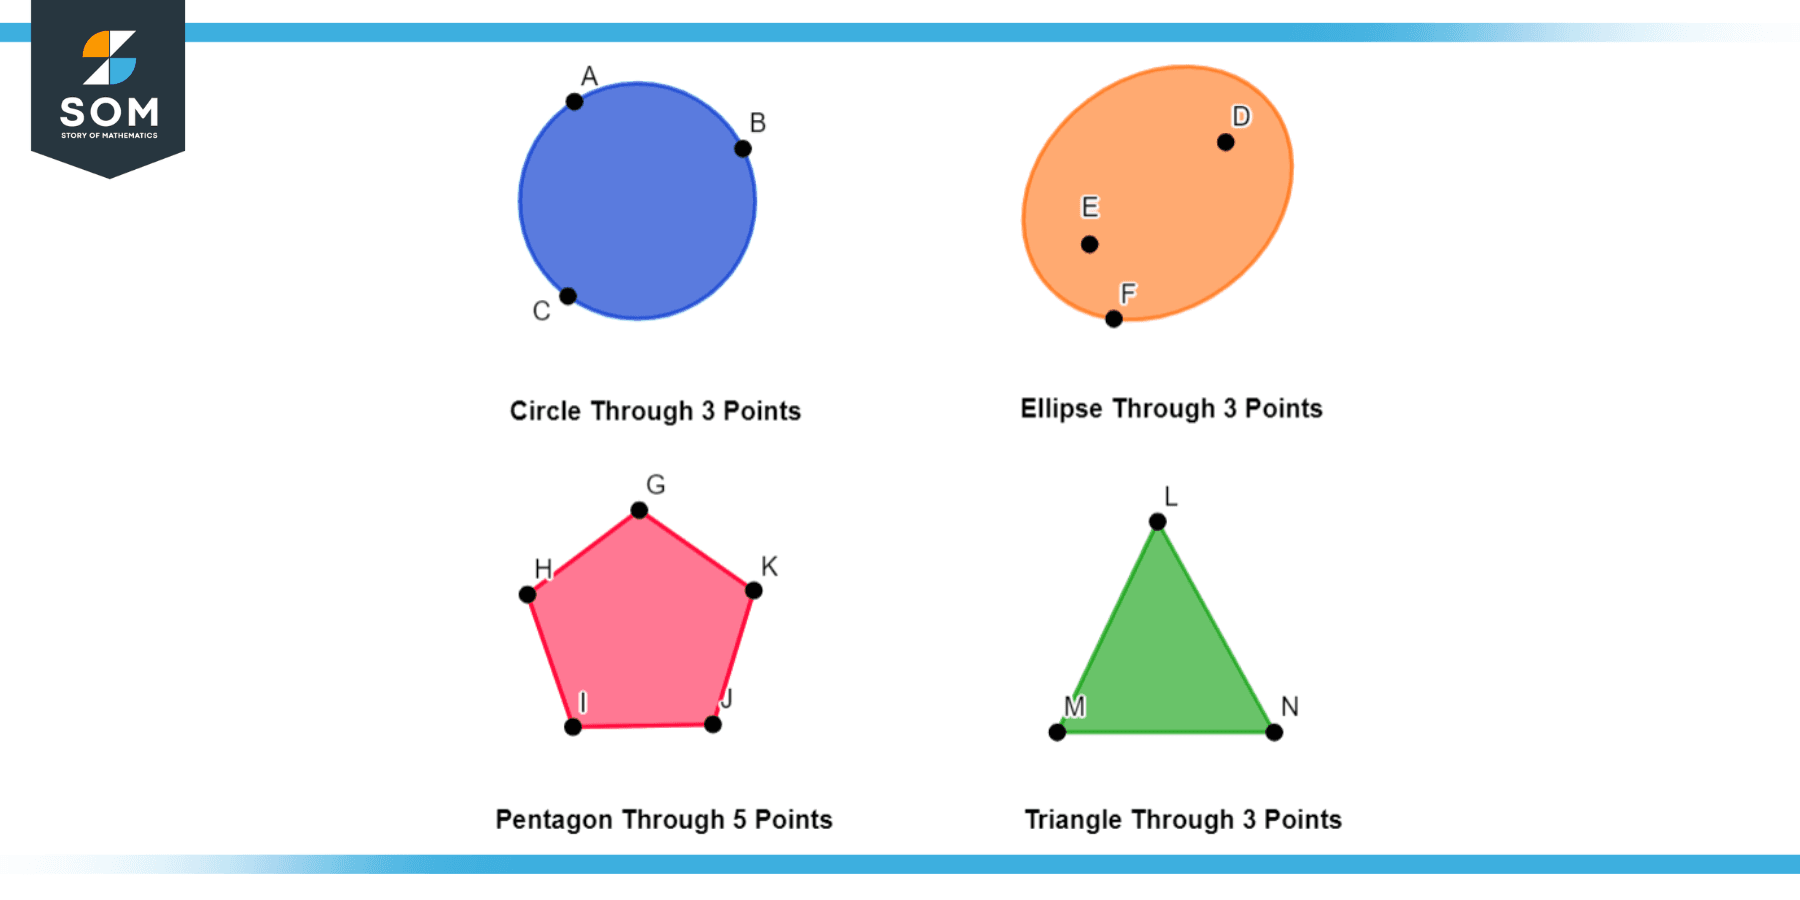
Figure 2 – Objects Formed By using Points
A point is often used in forming a graph as it can be used to represent the coordinates in a graph. A graph is formed on an x-y plane or sometimes on the x-y-z plane when we include the z plane. To help us understand and draw the graph we use points that represent the cartesian points or coordinates of the graph.
If we look at the following example we can see the graph which is quite easy to read and take information from due to the presence of points.
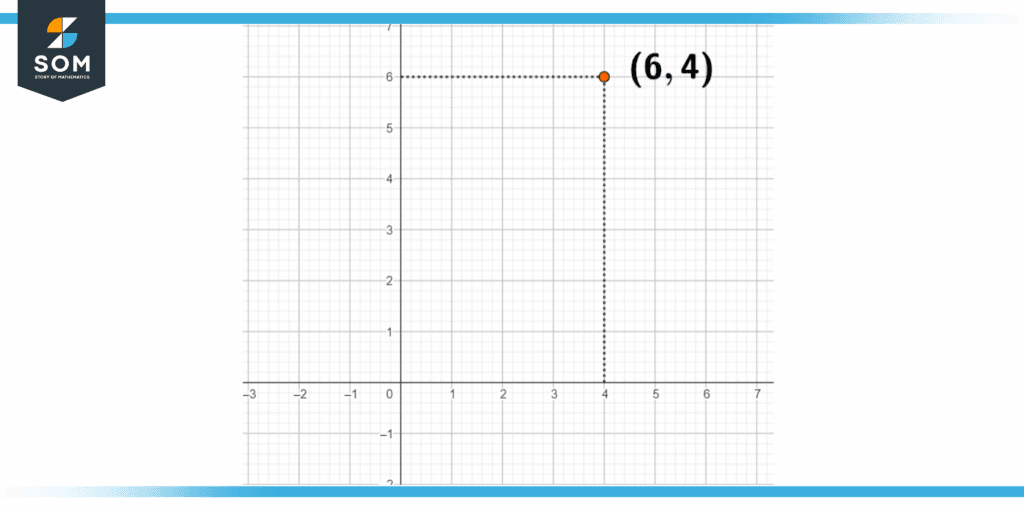
Figure 3 – Cartesian Coordinates formed with the help of points
Types of Point
We have divided points into 4 different parts. Let us discuss and take a look at them.
Collinear Points
If two or more points exist on a single straight line in a plane, then such points are called collinear points. In the following figure, you can see how all the points on the lone are collinear.
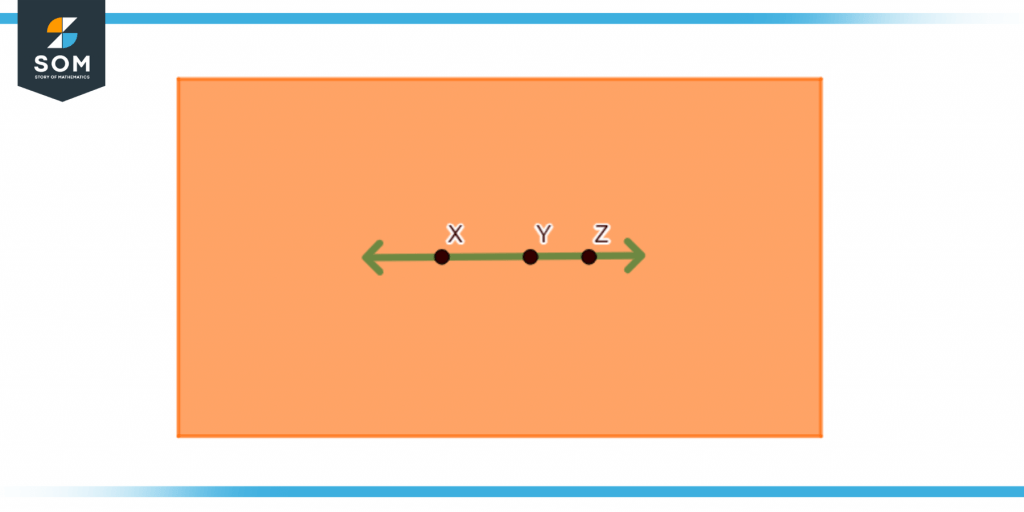
Figure 4 – Collinear points
Non-collinear Points
As the name suggests that it is opposite to collinear points. If a group of points in a plane does not exist on a single straight line, they are called non-collinear points. The following pictures show the existence of non-collinear points in any plane.
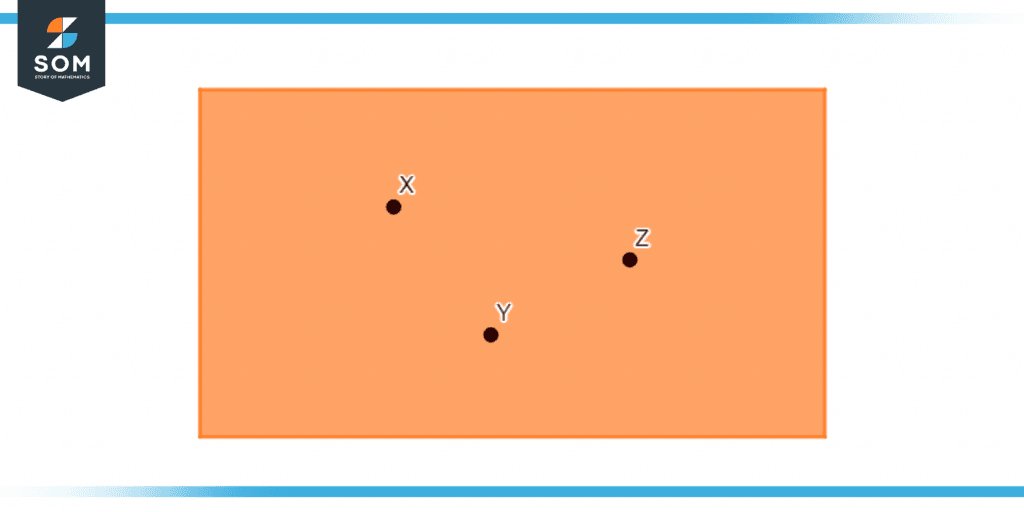
Figure 5 – Non-Collinear points.
Coplanar Points
If any group of points exists on the same plane, they are known as the coplanar points. The mutual plane between these points binds them together. The following picture shows coplanar points.
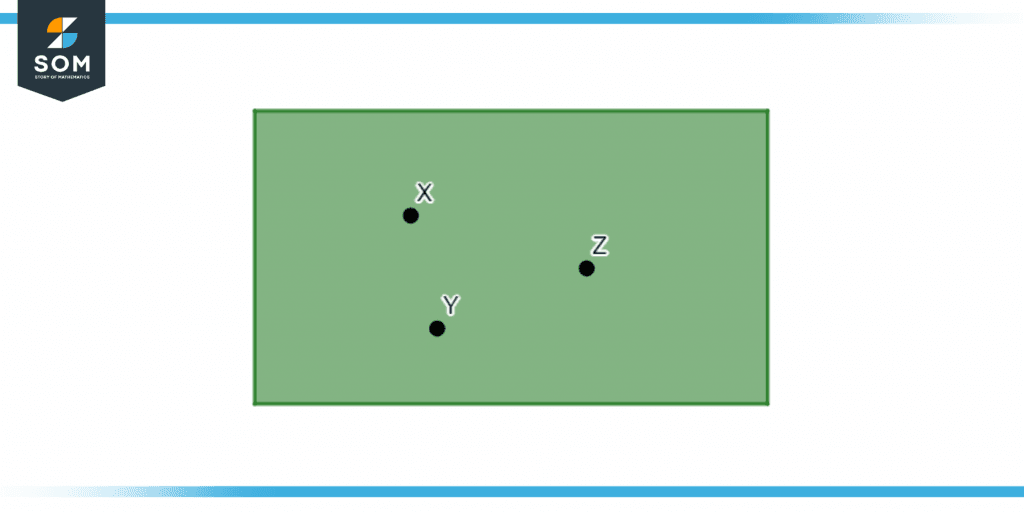
Figure 6 – Coplanar points in a plane.
Non-coplanar Points
Non-coplanar points are those points that lack the existence of a mutual plane between each point. So when any point exists outside of a plane, it is known as a non-coplanar point. The figure below shows the existence of a point outside the green plane, making it different from the rest of the points.
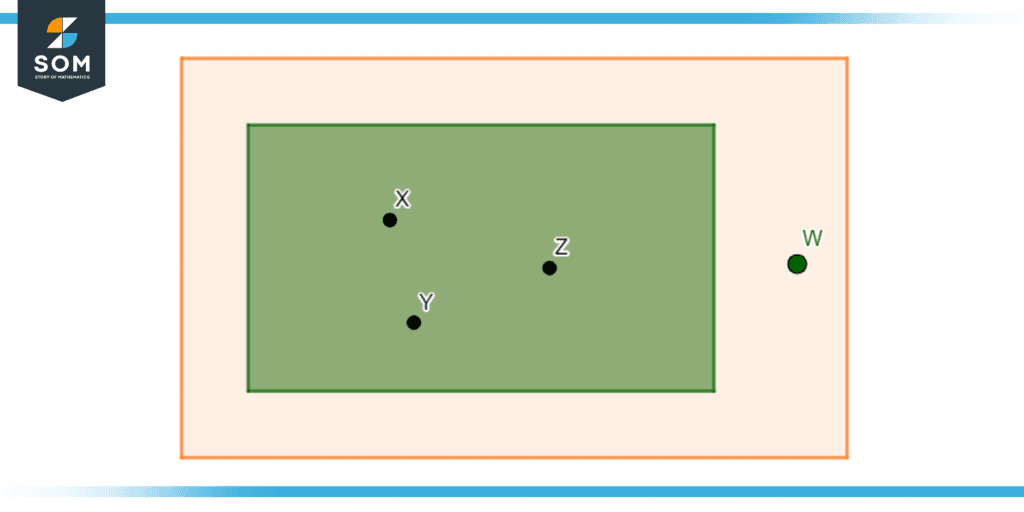
Figure 7 – Non-coplanar points with two different planes.
Solved Examples of Point
Example 1
Anthony’s teacher assigned him a task to find out what is the relation between a point and a line. Help him out with his homework.
Solution
A point is a dot (.) which is used to tell the location in any plane. Any point can be represented with the help of an alphabet. It has no length, width, or size. Points are dimensionless dots. It is used at the beginning of any shape or object.
A line is a collection of points that are joined together along a specific straight path. A line is represented by a single lowercase alphabet or two uppercase alphabets. A line extends to infinity and hence has no endpoints.
The relation between point and line is that points are joined together to form a line, so we can say that a line is just a collection of endless points in some arbitrary direction.
Example 2
Raven wants to find from the given figure what type of points exists. Explain your answer too.
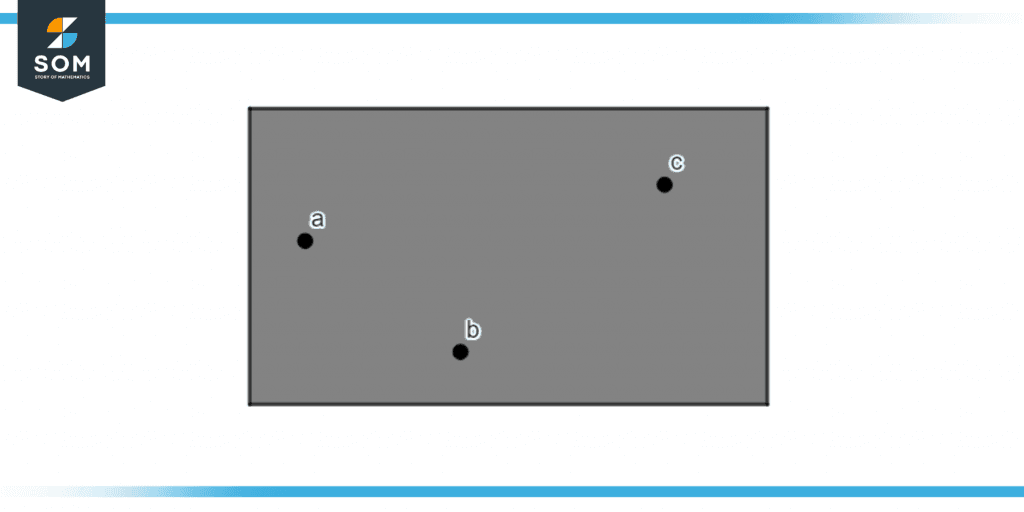
Figure 8 – Non-collinear points ABC.
Solution
For any group of points to be collinear, they must be in a straight line. Since the points in the given figure are not in a straight line, the points are non-collinear with respect to each other.
Non-collinear points are those that are opposite to collinear points. If a group of points in a plane does not exist on a single straight line, they are called non-collinear points.
Example 3
Find the slope from the given points in the graph.
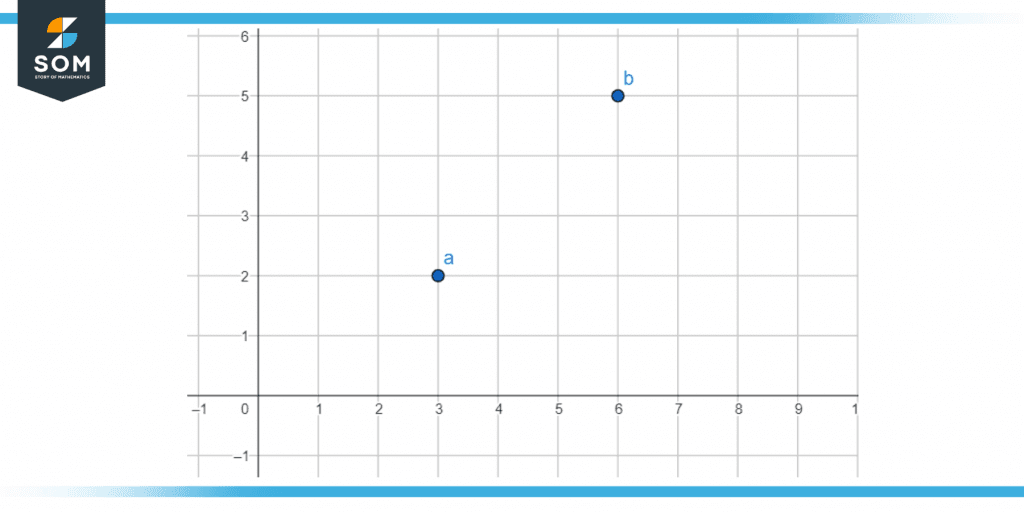
Figure 9 – Two points a and b forming a slope.
Solution
From the following figure, we can gather the data that there are 2 points a (2, 3) and b (5, 6).
So we use the equation of slope, which is:
Slope m = $\mathsf{\dfrac{y_2-y_1}{x_2-x_1}}$
We can use the delta symbol here in this equation too:
Slope m = $\mathsf{\dfrac{∆y}{∆x}}$
Let us make the vertical and horizontal changes in a and b.
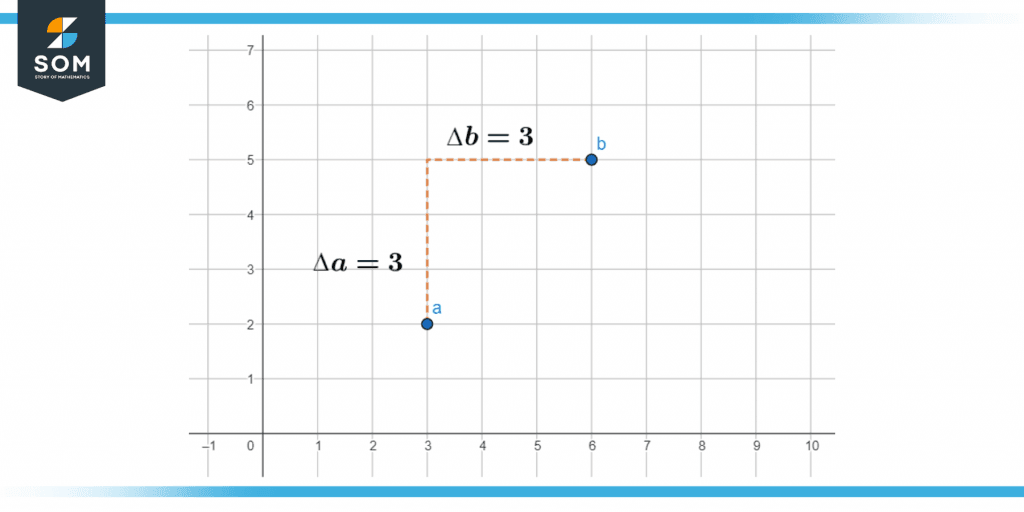
Figure 10 – Delta of a and b points.
Now let us put the values in the equation:
Slope m = $\mathsf{\dfrac{3}{3}}$
m = 1
We can use the points by putting values in the equation. The position or order of these points does not concern us. Let us take a look:
Slope m = $\mathsf{\dfrac{y_2-y_1}{x_2-x_1}}$
Putting values:
m = $\mathsf{\dfrac{6-3}{5-2}}$
m = $\dfrac{3}{3}$
m = 1
So we can use both methods to find the difference between each point.
Example 4
Bloom wants to know some real-life examples of points for her math project. Help her out!
Solution
Some of the real-life examples of points are as below:
- Location points of any location on a map are represented with the help of points.
- The tip of a pencil represents a point.
- The end of a needle represents a point.
- A star in the sky represents points. They are considered in both collinear and noncollinear categories.
- The singularity of the big bang theory represents the point.
- In the stock market, inflection points are used.
Images/mathematical drawings are created with GeoGebra.