JUMP TO TOPIC
The following figure shows how the population is represented.
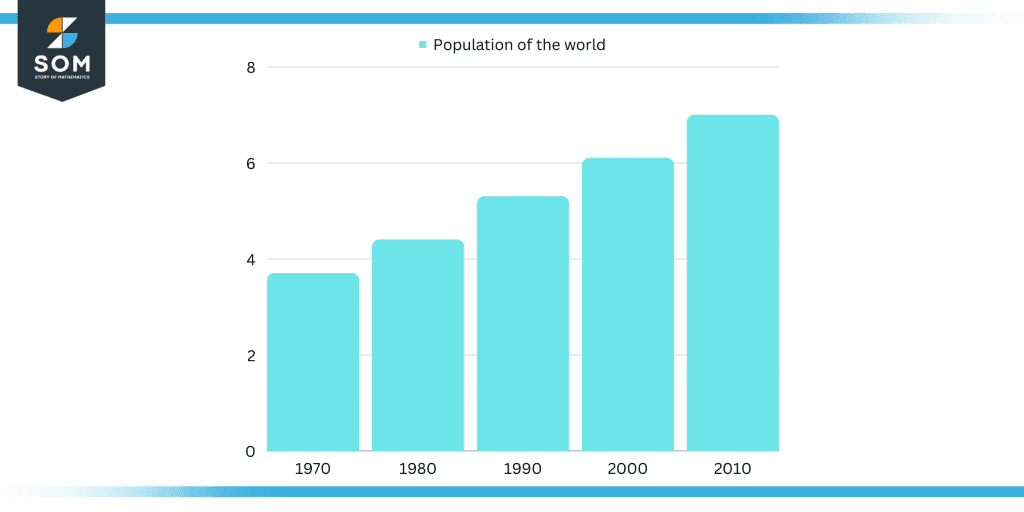
Figure 1 – Representation of population.
Data Collection
Data collection is information collected by observations, measurements, research, or analysis. It may contain facts, statistics, quantities, names, or general descriptions of various items.
Data for our study can be provided in graphs, charts, or tables. Data scientists use data mining to aid in the survey of the collected data.
Mean
In mathematics, particularly statistics, there are various types of means. Each mean is used to frequently summarise a specific data set to comprehend better the total value (volume and direction) of a particular data set.
The arithmetic mean, often known as the “arithmetic average,” of a data collection is a measure of the central tendency of the finite set of numbers: precisely, the sum of the values multiplied by the number of values.
Median
The median is the number that divides a sample data, population, or probability into the upper and lower half. In data collecting, it is usually referred to as “the center” value.
In summarising data, the fundamental difference between both the median and, thus, the mean is that the median is not skewed by a tiny proportion of extraordinarily huge or small values. It so provides a more accurate representation of an “average” value.
Samples
A statistic is a quantifiable attribute of a sample that contains one or even more observations collected from the population. The process of picking a sample from a population is known as sampling. Some persons in India, for example, are a sample of the entire population.
In general, there are two forms of sampling. They are as follows:
- Sampling by Probability
- Non-probability sample selection
Sampling by Probability
The population units in probability sampling cannot be chosen at the researcher’s choice. This may be handled by following specific processes that ensure that every individual in the population has one set probability of being taken into the sample. This procedure is also known as random sampling.
Non-probability Sample Selection
The population units in non-probability sampling can be chosen at the researcher’s discretion. Those samples will employ human judgment to choose units and have no theoretical foundation for determining population characteristics.
Figure 2 below shows the population and samples.
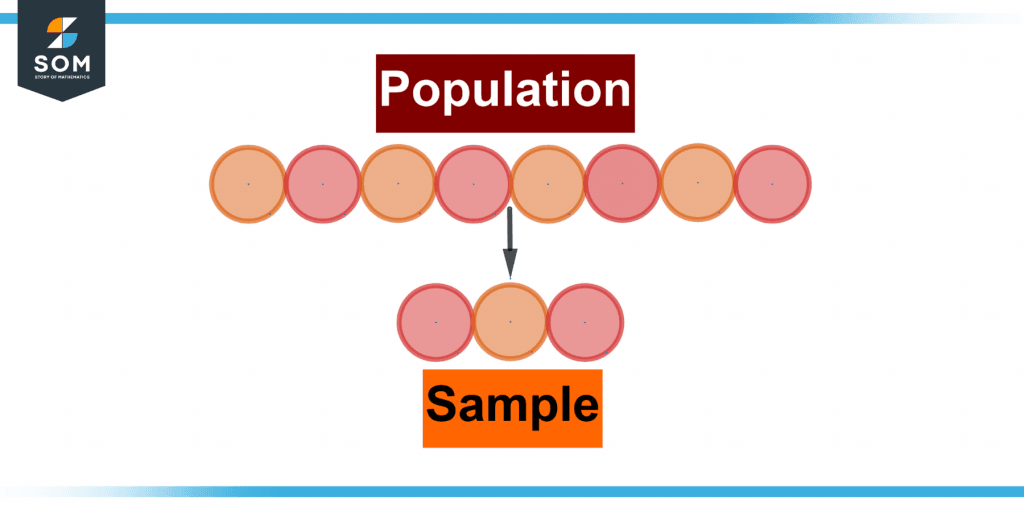
Figure 2 – Representation of population and sample.
Types of Population
There are several sorts of populations. They are as follows:
- Existing Population
- Finite Population
- Infinite Population
- Hypothetical Population
Existing Population
The existing population is the population of specific individuals. In other words, the existing population is the population for whom the unit is available as a solid. Books, pupils, and so on are examples.
Finite Population
A finite population is sometimes called a calculable population since the population can be tallied. In other terms, it is described as the population among all finite persons or things. For statistical analysis, a limited population is preferable to an infinite population. Employees of a firm and potential consumers in a market are examples of finite populations.
Infinite Population
The infinite population, often known as an uncountable population, is one in which counting units is impossible. The quantity of viruses in the patient’s body is an example of an endless population.
Hypothetical Population
The hypothetical population is a population where constituents are not concretely available. A population comprises groupings of observations, items, and so on that, all share some features. In other circumstances, the populations are purely fictitious. Examples include the outcome of a dice roll and coin flip.
The Formula for Population Mean
A population in statistics is a collection of items, such as numbers, people, objects, etc. The population means equation may be calculated by dividing the total of all the data by the number of pieces.
The term population in static refers to data collection, such as a group of people, items, or statistics. The population mean is the aggregate mean of this data. The population parameter formula may be calculated by dividing the total of all data by the number of pieces.
The population parameter formula is the group’s arithmetic mean. It is derived by adding all of the pieces of data and afterward dividing by amount of items in the group.
Figure 3 below shows the formula for the population mean.
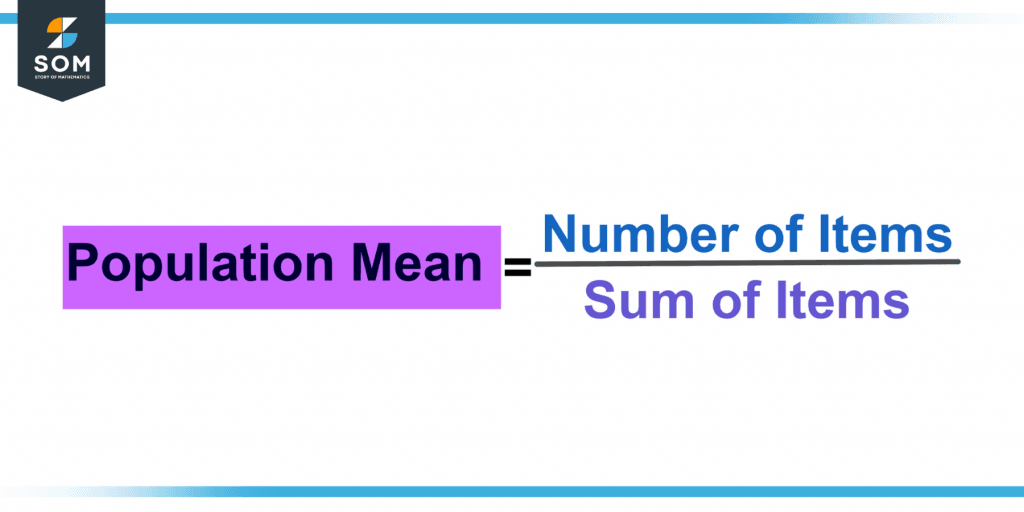
Figure 3 – Formula for the population mean.
Population Variance Formula
Let us first define population variance before understanding the population variance formula. The squared deviation of all readings (Xi) of a stochastic process (X) first from the population means ($\mu$) over the entire population is defined as population variance ($\sigma ^{2}$).
Figure 4 below shows the population variance formula. It calculates the deviation of the stochastic process from the population mean.
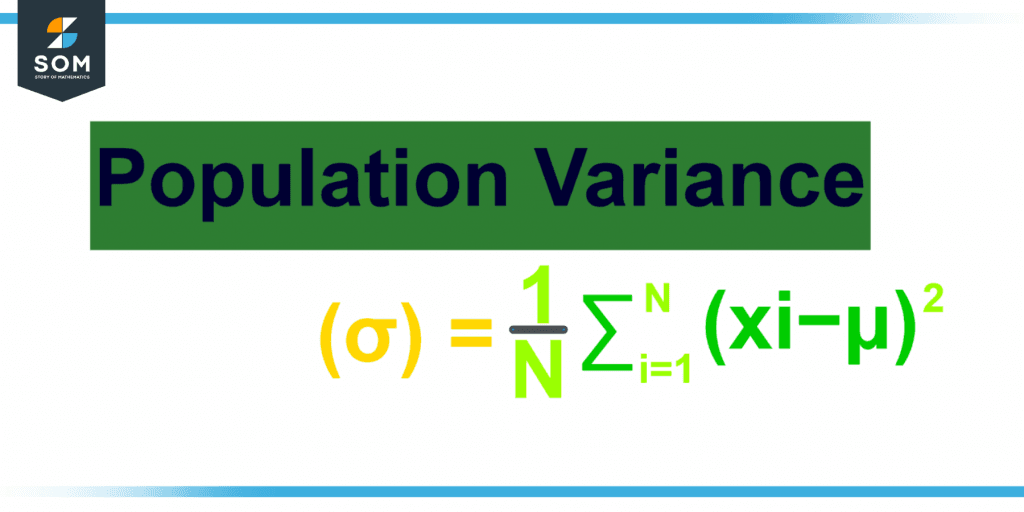
Figure 4 – Formula for population variance.
Examples of Population
A few examples of the population are given below.
Example 1
Calculate the mean of the given set of points to use the population mean formula.
Data: {12, 6, 15, 13, 5, 21, 11, 10, 10, 9}
Solution
We need to find the population mean for the provided data: {12, 6, 15, 13, 5, 21, 11, 10, 10, 9}
Using the formula for the population mean:
population mean = total number of items / the total number of things.
Entering the values:
= (12 + 6 + 15 + 13 + 4 + 20 + 11 + 10 + 10 + 9) / 10
= 110 / 10
= 11
The overall mean of the supplied collection of data points is 11.
Example 2
Using the following data determine the population density using the given information.
Dataset = {44, 58, 55, 45, 51}
Solution
The given dataset is: {44, 45, 51, 55, 58}
Again, we need to find the population mean. By employing the population mean formula:
population mean = total number of items / the total number of things.
population mean = (44 + 58 + 55 + 45 + 51) / 10 = 253/5
The population mean is 253/5 = 50.6. Thus, the presented data has a population density of 50.6.
Example 3
Calculate the mean of the given set of points to use the population mean formula.
Data: {1, 2, 3, 4, 5, 6, 7, 8, 9, 10}
Solution
Data given = {1, 2, 3, 4, 5, 6, 7, 8, 9, 10}
We need to find the population mean. By employing the population mean formula:
population mean = total number of items / the total number of things
Enter the values:
= (1 + 2 + 3 + 4 + 5 + 6 + 7 + 8 + 9 + 10) / 10
= 55 / 10
= 5.5
The overall mean of the supplied collection of data points is 5.5.
All images are made using GeoGebra.