JUMP TO TOPIC
- Definition
- What Is the Standard Deviation?
- Why Do We Need SD and Variance?
- What Is the Relationship Between SD and Variance?
- Variance and Standard Deviation Formula
- Variance Formula
- How Are Variance and Standard Deviation Calculated?
- Strengths of Standard Deviation
- Limitations of Standard Deviation
- Standard Deviation Solved Examples
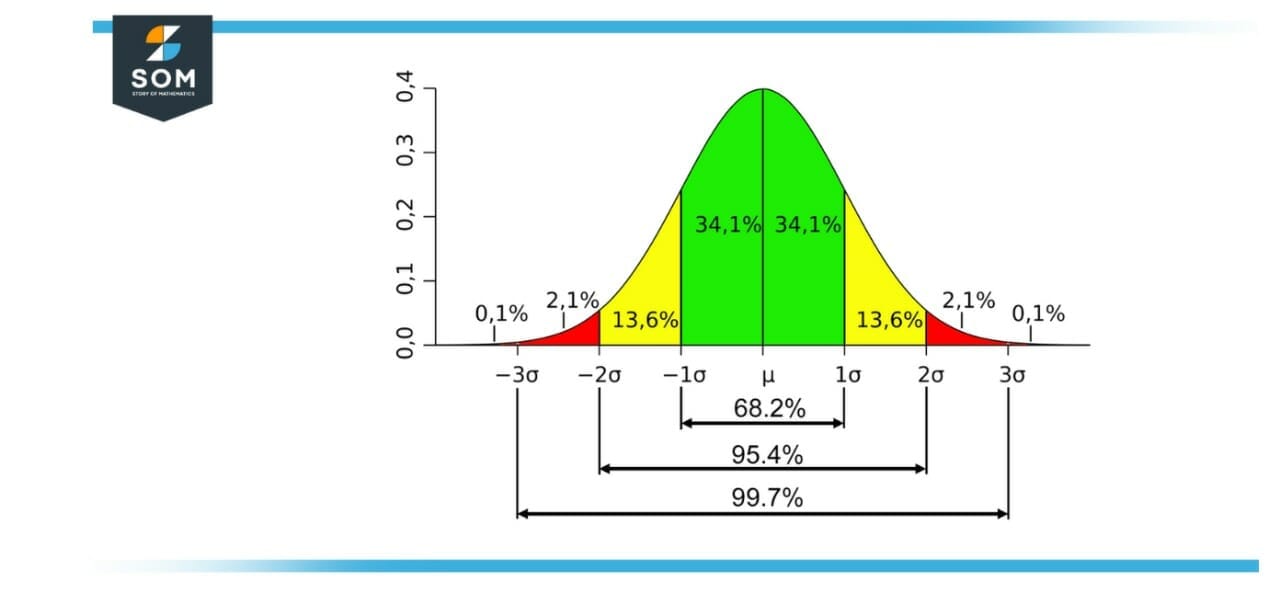
Figure 1: A normal distribution curve demonstrating standard deviation
What Is the Standard Deviation?
The term “standard deviation” (or “σ”) refers to a measurement of the facts’ dispersion from the mean. A low standard deviation implies that the facts are grouped across the mean, while a well-known massive deviation indicates that the facts are more dispersed.
Why Do We Need SD and Variance?
In essence, the variance and standard deviation are used to compute how widely apart the values in a particular data collection are from the mean, and the mean is the average of the range of those values.
Estimate that 34.1 + 34.1 = 68.2% of students will get results that are one standard deviation off the mean or extremely near the average.
What Is the Relationship Between SD and Variance?
While the standard deviation is the number’s square root, the variance is equal to the average data. The data’s divergence from the mean or average location is measured by the distribution. The method of determining the deviation of data points is used to calculate the degree of dispersion. It is denoted by the symbol, ‘σ.’
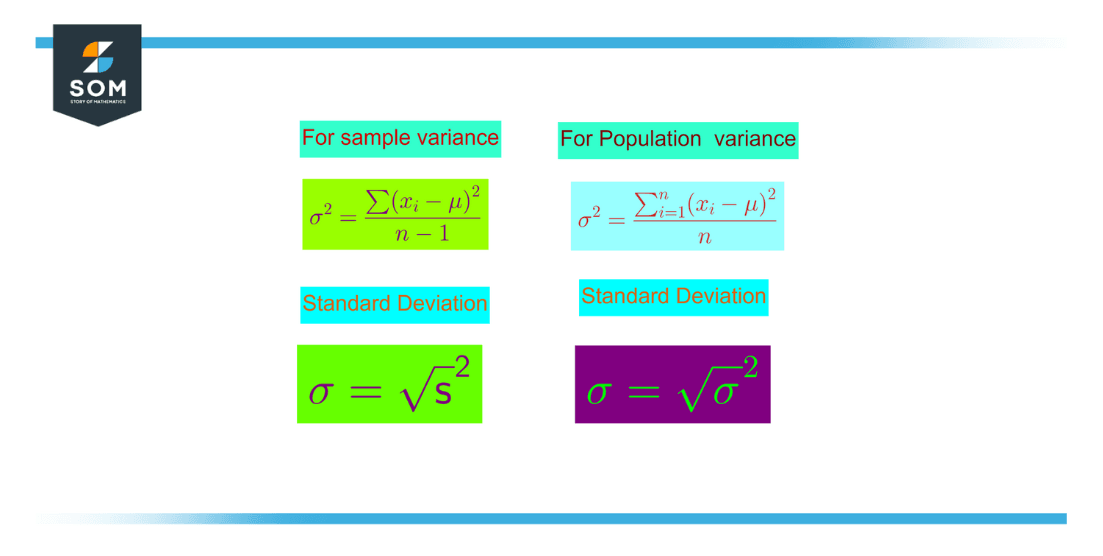
Figure 2: Difference between the variance and standard deviation of samples vs. population
Properties of Standard Deviation
- It is likewise referred to as the root-suggest-rectangular deviation and describes the rectangular root of the suggest of the squares of all values in a records collection.
- The standard deviation’s lowest value is zero since it cannot be negative.
- The standard deviation will be very small or almost negligible when the data values of a group are similar. However, the standard deviation is high or distant from zero when the data values differ from one another.
Variance and Standard Deviation Formula
The average square distance between each data value and the mean value, as was previously said, is the data set’s variance. The variation in data values around the mean is defined by standard deviation.
Following are the formulae for variance and standard deviation for both population and sample data sets:
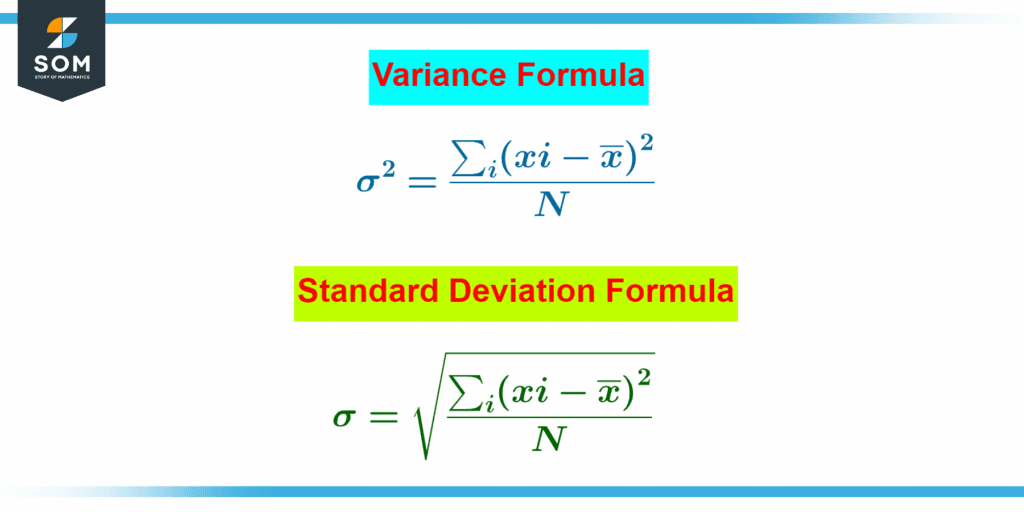
Figure 3: Formulae for standard deviation and variance.
Variance Formula
The population variance formula is given:
\[ \sigma^2 = \frac{\sum(x_i-\overline{x})^2}{N} \]
The population variance (2) reveals the distribution of data points within a given population. It is the average of the squared distances between each population data point and the mean.
Standard Deviation Formula
The following is the formula for the population standard deviation:
\[ \sigma = \sqrt{\frac{\sum_i(x_i-\overline{x})^2}{N}} \]
Here, σ is the population’s standard deviation.
In this equation, xi is the standard deviation, xi is the ith data point, µ is the mean of the data set, and the data set’s total number of data points is N.
What Can You Infer From the Standard Deviation?
The standard deviation measures the degree of dispersion of a collection of data. Each data point is compared to the average of all the data points, and the standard deviation gives a determined number that indicates whether the data points are clustered together or dispersed. The standard deviation of a normal distribution indicates how far values deviate from the mean.
How Are Variance and Standard Deviation Calculated?
To obtain the squared differences, you square the results after subtracting the mean from each value to calculate the variance. The average of those squared differences is then calculated. The variance is the outcome. A distribution’s standard deviation serves as a gauge for how dispersed the numbers are.
Strengths of Standard Deviation
A popular metric for dispersion is the standard deviation. Compared to other statistical computations of data variance, the standard deviation is arguably better familiar to analysts. The standard deviation is, therefore, extensively used in many situations, such as finance and actuarial work.
A unique combined standard deviation formula can be used to combine the standard deviation of two data sets. For other dispersion observation measures, there are no comparable formulas in statistics. In contrast to other methods of observation, the standard deviation can also be employed in further algebraic calculations.
Limitations of Standard Deviation
When employing standard deviation, there are various drawbacks to take into account. The standard deviation does not truly quantify how distant off the mean a data item is. Instead of comparing actual dispersion from the mean, it measures the square of the differences, which is a slight but important distinction.
Standard Deviation Solved Examples
Example 1
A garden has 39 plants. The following plants were picked at random and measured in cm: 48, 54, 56, 76, and 68. Determine the standard deviation of their heights.
Solution
As a result, the number of observations = 5
As a result, the mean of 5 observations is:
Mean = (48 + 54 + 56 + 76 + 68) / 5 = 302/5 = 60.4
The standard deviation is now computed as follows:
Standard Deviation, SD = $\displaystyle\sigma = \sqrt{\frac{\sum_i(x_i-\overline{x})^2}{N}}$
Now, substitute the values in the formula, we get:
S.D = $\mathsf{\dfrac{\sqrt{(48-60.4)^2+ (54-60.4)^2+ (56-60.4)^2+ (76-60.4)^2+(68-60.4)^2}}{4}}$
Summing up the terms within square root:
= 153.76 + 12.8 + 19.36 + 243.36 + 57.76
Now, taking the square root:
= $\sqrt{487.04}$
= 22.06
When we solve the above formula, we obtain:
S.D = 22.06
As a result, their standard deviation (S.D.) is 22.06.
Example 2
You produce 20 crystals from a solution and measure each crystal’s length in millimetres. Here is your information:
= 10 + 6 + 12 + 52 + 16 + 22 + 8 + 24 + 13 + 32 + 17 + 14 + 12 + 15 + 42 + 26 + 19 + 16 + 21 + 28
The crystal length sample standard deviation should be determined.
Solution
Determine the data’s mean. Divide the sum of all the numbers by the total number of data points.
= (10 + 6 + 12 + 52 + 16 + 22 + 8 + 24 + 13 + 32 + 17 + 14 + 12 + 15 + 42 + 26 + 19 + 16 + 21 + 28) / 20
= 405/20 = 20.25
Subtract the suggest from every facts point (or the alternative manner around, in case you prefer. You may be squaring this number, so it does now no longer count the number if it’s miles nice or negative):
(10 – 7)2 = (3)2 = 9
(6 – 20.25)2 = (-14.25)2 = 203.06
(12 – 20.25)2 = (-8.25)2 = 68.06
(52 – 20.25)2 = (31.75)2 = 1008.06
(16 – 20.25)2 = (-4.25)2 = 18.06
(22 – 20.25)2 = (1.75)2 = 3.06
(8 -20.25)2 = (-12.25)2 = 150.06
(24 – 20.25)2 = (3.75)2 = 14.06
(13 -20.25)2 = (-7.25)2 = 52.56
(32 -20.25)2 = (-11.75)2 = 138.06
(14 -20.25)2 = (-6.25)2 = 39.06
(12 -20.25)2 = (-8.25)2 = 68.06
(15 -20.25)2 = (-5.25)2 = 27.56
(42 -20.25)2 = (-19.75)2 = 390.06
(26 -20.25)2 = (5.75)2 = 33.06
(19 -20.25)2 = (-1.25)2 = 1.56
(16 – 20.25)2 = (-4.25)2 = 76.76
(21 – 20.25)2 = (0.75)2 = 0.56
(28 -20.25)2 = (7.75)2 = 60.06
(10 – 20.25)2 = (-10.25)2 = 105.06
Determine the difference’s squared mean. Since the fraction is too long for one line, we separate it into two batches of 10. For the first 10 terms, the fraction is:
p1 = (203.06 + 68.06 + 1008.06 + 18.06 + 3.06 + 150.06 + 14.06 + 52.56 + 138.06)/19 = 1655.04/19
For the next ten terms, the fraction is:
p2 = (39.06 + 68.06 + 27.56 + 390.06 + 33.06 + 1.56 + 76.76 + 0.56 + 60.06 + 105.06)/19 = 801.8/19
Adding the two parts:
p1 + p2 = 2456.84/19 = 129.30
The sample variance is this number. Therefore, 129.30 is the sample variance.
The variance’s square root equals the population standard deviation. Calculate this value using a calculator. $\mathsf{\sqrt{129.30}}$ = 11.371. The average deviation for the population is 11.371.
All images were created with GeoGebra.