JUMP TO TOPIC
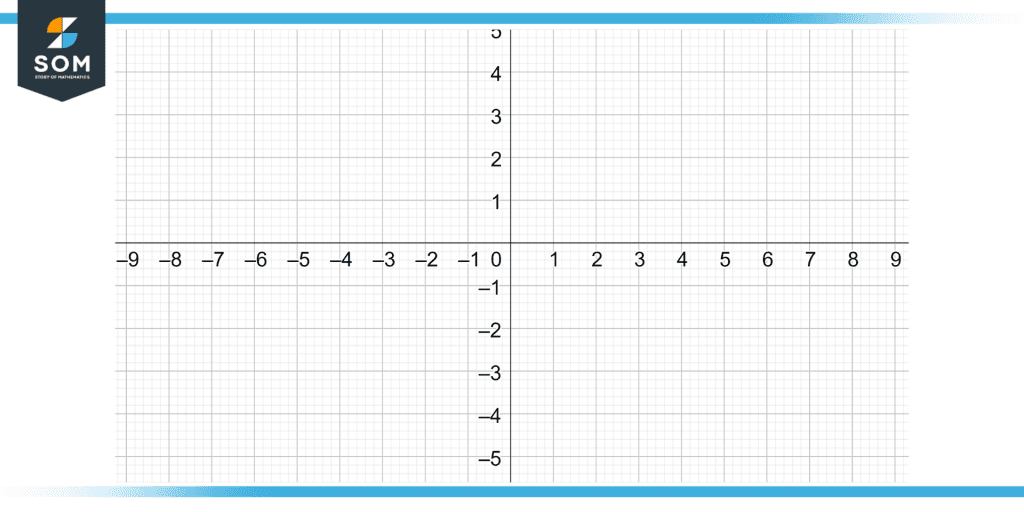
Figure 1: A Cartesian graph with an x and a y-axis with numbers for reference.
Furthermore, It is used in many fields, such as mathematics, physics, engineering, and data visualization, to represent and analyze data. In a graph, the x-axis is the horizontal line on which the dependent variable is plotted, and the y-axis is the vertical line. The direction of increasing values on the x-axis is typically from left to right.
An x-axis is an important tool for understanding and interpreting data in many fields, and it plays a crucial role in the analysis and visualization of data.
X Axis and Its History in Mathematics
The x-axis, along with the y-axis, is a fundamental component of the cartesian coordinate system. This system was invented by the French mathematician and philosopher René Descartes in the 17th century, and it revolutionized the way mathematical concepts and geometric shapes were represented and studied.
Before Descartes’ invention, geometric shapes and mathematical concepts were represented using a variety of methods, such as drawing geometric shapes by hand or using tables of numbers. Descartes’ cartesian coordinate system, however, allowed for a more precise and systematic way of representing points, lines, and shapes using numerical coordinates.
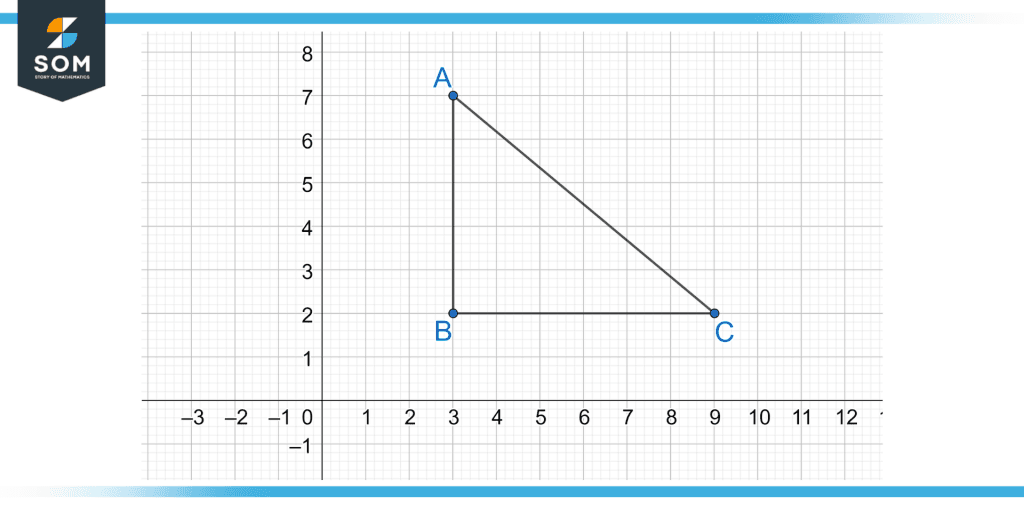
Figure 2: A Triangle depicted on the graph using the cartesian coordinate systems
Moreover, the x-axis has been used in mathematics ever since, in fields such as algebra, calculus, and geometry. In algebra, the x-axis is often used to plot the solutions to equations, and it is used to represent the independent variable in functions. Furthermore, in calculus, it is used to represent the domain of a function, and it is used in concepts such as limits and derivatives.
As technology and computer technology advancements, the use of the x-axis has expanded to fields such as data visualization, data analysis, and computer graphics. The x-axis is now used in a wide range of applications, from simple line and bar charts to complex three-dimensional models. The x-axis continues to play an important role in the representation and analysis of data in many fields.
Construction of an X-axis in a Cartesian Coordinate System
As we already know, the x-axis is the horizontal line that goes through the origin point towards a finite or infinite length. Hence, for its construction geometrically on a graph, we would require a pencil and a scaled ruler to generate the right length and scaling for the x-axis to completely depict the point coordinates on its line.
The following are the basic steps to construct a simple x-axis on a cartesian coordinate system:
- Choose a location for the origin of the X-axis.
- Determine the range of values that will be plotted on the X-axis, and choose an appropriate scale.
- Draw a horizontal line that begins at the origin and extends to the right. This line represents the X-axis.
- Place line marks along the X-axis at regular intervals using the chosen scale. For example, if the scale is 1 cm = 1 unit, place tick marks every 1 cm.
- Label the line marks with the corresponding values. For example, if the first line mark is at 0.5 cm, label it “0.5.”
- Finally, label the X-axis with the letter “X” to indicate that it is the horizontal axis of the Cartesian coordinate system.
The above steps are basic steps to construct a properly scaled x-axis. However, depending upon the application and requirement, some extra steps or steps can be omitted.
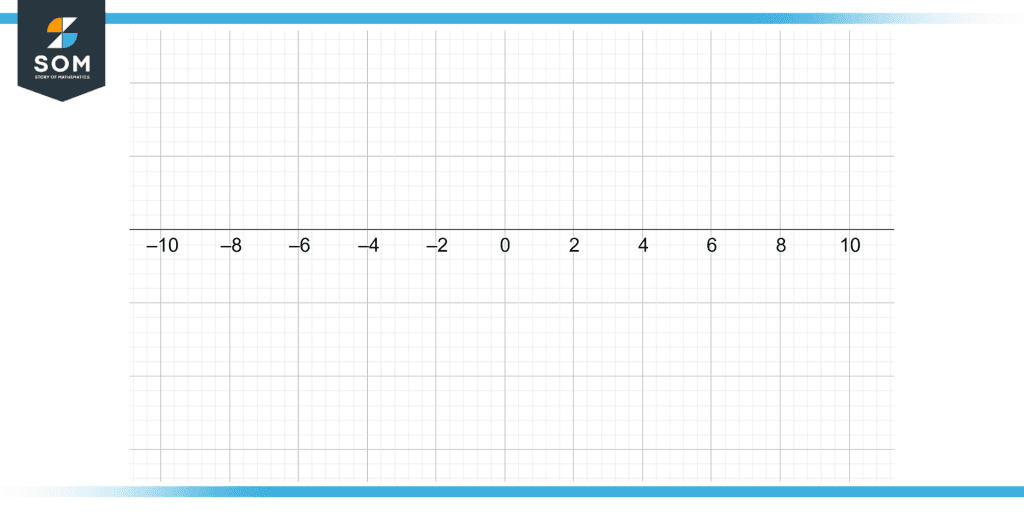
Figure 3: A scaled X-axis in a cartesian coordinate system with a marked interval after two points ranging from -10 to 10 units.
Significance of X-axis in Practical Applications
The X-axis is a fundamental concept in many real-life applications, as it represents the horizontal position or location of an object or data point. One of the most common uses of the X-axis is in data visualization.
In line graphs, bar charts, and scatter plots, the X-axis is often used to represent time or a continuous variable. This allows us to see patterns and trends over time or concerning other variables, making it easier to understand and analyze large sets of data.
Another important use of the X-axis is in navigation and mapping. The X-axis, in conjunction with the Y-axis, is used to represent the horizontal position of an object or location on a map or in a coordinate system.
This allows for precise navigation and location tracking. For example, GPS systems use the X and Y coordinates to determine the exact location of a vehicle or person.
Moreover, in physics, the X-axis is used to represent distance or displacement in motion problems. For example, in calculating speed, velocity, or acceleration, the X-axis is used to represent the distance traveled.
Furthermore, in engineering, the X-axis is used in stress-strain diagrams to represent the amount of deformation or strain in a material. This allows engineers to design and test materials to ensure they can withstand the forces they will be subjected to in real-world applications.
An Illustrative Example Explaining the Usage of X-axis
Given are the four coordinates of a shape’s vertices:
[(2,1), (1,3), (4,1), (3,2)]
Draw a graph of the following coordinates. Furthermore, find the mean of the x-coordinates of the shape.
Solution
First of all, we are given four coordinates, and their x-coordinates are 2, 1, 4, and 3. We need to find the mean of the x-coordinates of these 3 points that can be found by using the following process.
Mean = Sum of all numbers $\div$ Number of samples
Mean = (2 + 1 + 4 + 3) $\div$ 4
Mean = 10 $\div$ 4
Mean = 2.5
Hence, we can mark 2.5 on the x-axis as the mean x-coordinate of the set of samples provided.
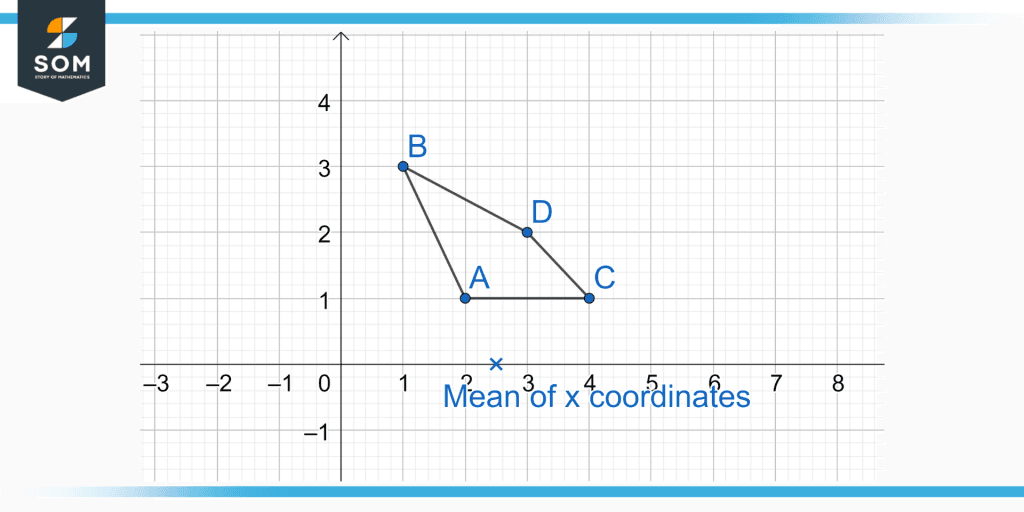
Figure 4: A shape formed from the four coordinates with a mean point of x-coordinates marked at 2.5 units of x.
All the mathematical figures and graphs were made using GeoGebra.