JUMP TO TOPIC
It is the line from bottom to top on a graph that is known as a y-axis. Coordinates are measured parallel to this axis.
It is called a y-coordinate when a number is placed on one of the y-axes. When two coordinates are ordered, they will be written between parentheses, with the x-coordinates coming first, followed by the y-coordinates: (x, y).

Figure 1 Representation of x-axis and y-axis
Which Comes First, the X-axis or the Y-axis?
A coordinate is located by locating an ordered pair composed of (x-coordinate, y-coordinate) or (x, y). and a point on the x-axis is represented by an x-coordinate and a point on the y-axis is represented by a y-coordinate, which indicates that x-axis is written first when locating a point along an ordered pair.
On the graph, the x-axis and y-axis are stated in the order, with the x-axis leading to the y-axis.
Ordinate
An ordered pair has an ordinate as its second component. An ordered pair would, for example, be (x, y), where y would be the ordinate if (x, y) were an ordered pair. Ordered pairs denote cartesian plane points.
In a system of fixed Cartesian Coordinate plane, it is the second term in (x, y) that denotes how a system of Cartesian coordinates can define a point. There is a term called abscissa, which refers to the first coordinate in the plane (x).
Numerical coordinates are used to describe each point of the XY plane in the Cartesian system. Each point represents a distance measured by the same unit of length from the two fixed axes. For example, In the Cartesian plane, consider a point A with coordinates (3, 5), where 5 is the ordinate, and a point B with coordinates (3, -1), where -5 is the ordinate.
It should be kept in mind that point A has a positive ordinate, so we will move to the positive side of the y-axis from the origin (0, 0) at 5 equal divisions, whereas point B will move towards the negative side at 1 equal division, depending on which way the ordinate lies.
Cartesian Coordinate System
In a coordinate system, two perpendicular lines are used to determine the position of a point in a plane based on the coordinates of the point. In two-dimension concerning the vertical axis and the horizontal axis, points are represented by coordinates (x, y) in two dimensions.
One-Dimensional Cartesian Coordinates
An arrangement of one-dimensional coordinates known as the Cartesian coordinate system is based on a line system. The line is drawn with a point O as the origin, a unit for defining the length of the line, as well as its orientation. In each half-line determined by O, the orientation determines which half-line is positive and which is negative.
Taking the distance from O for every point P on the line, we can specify its value as a negative or positive number.
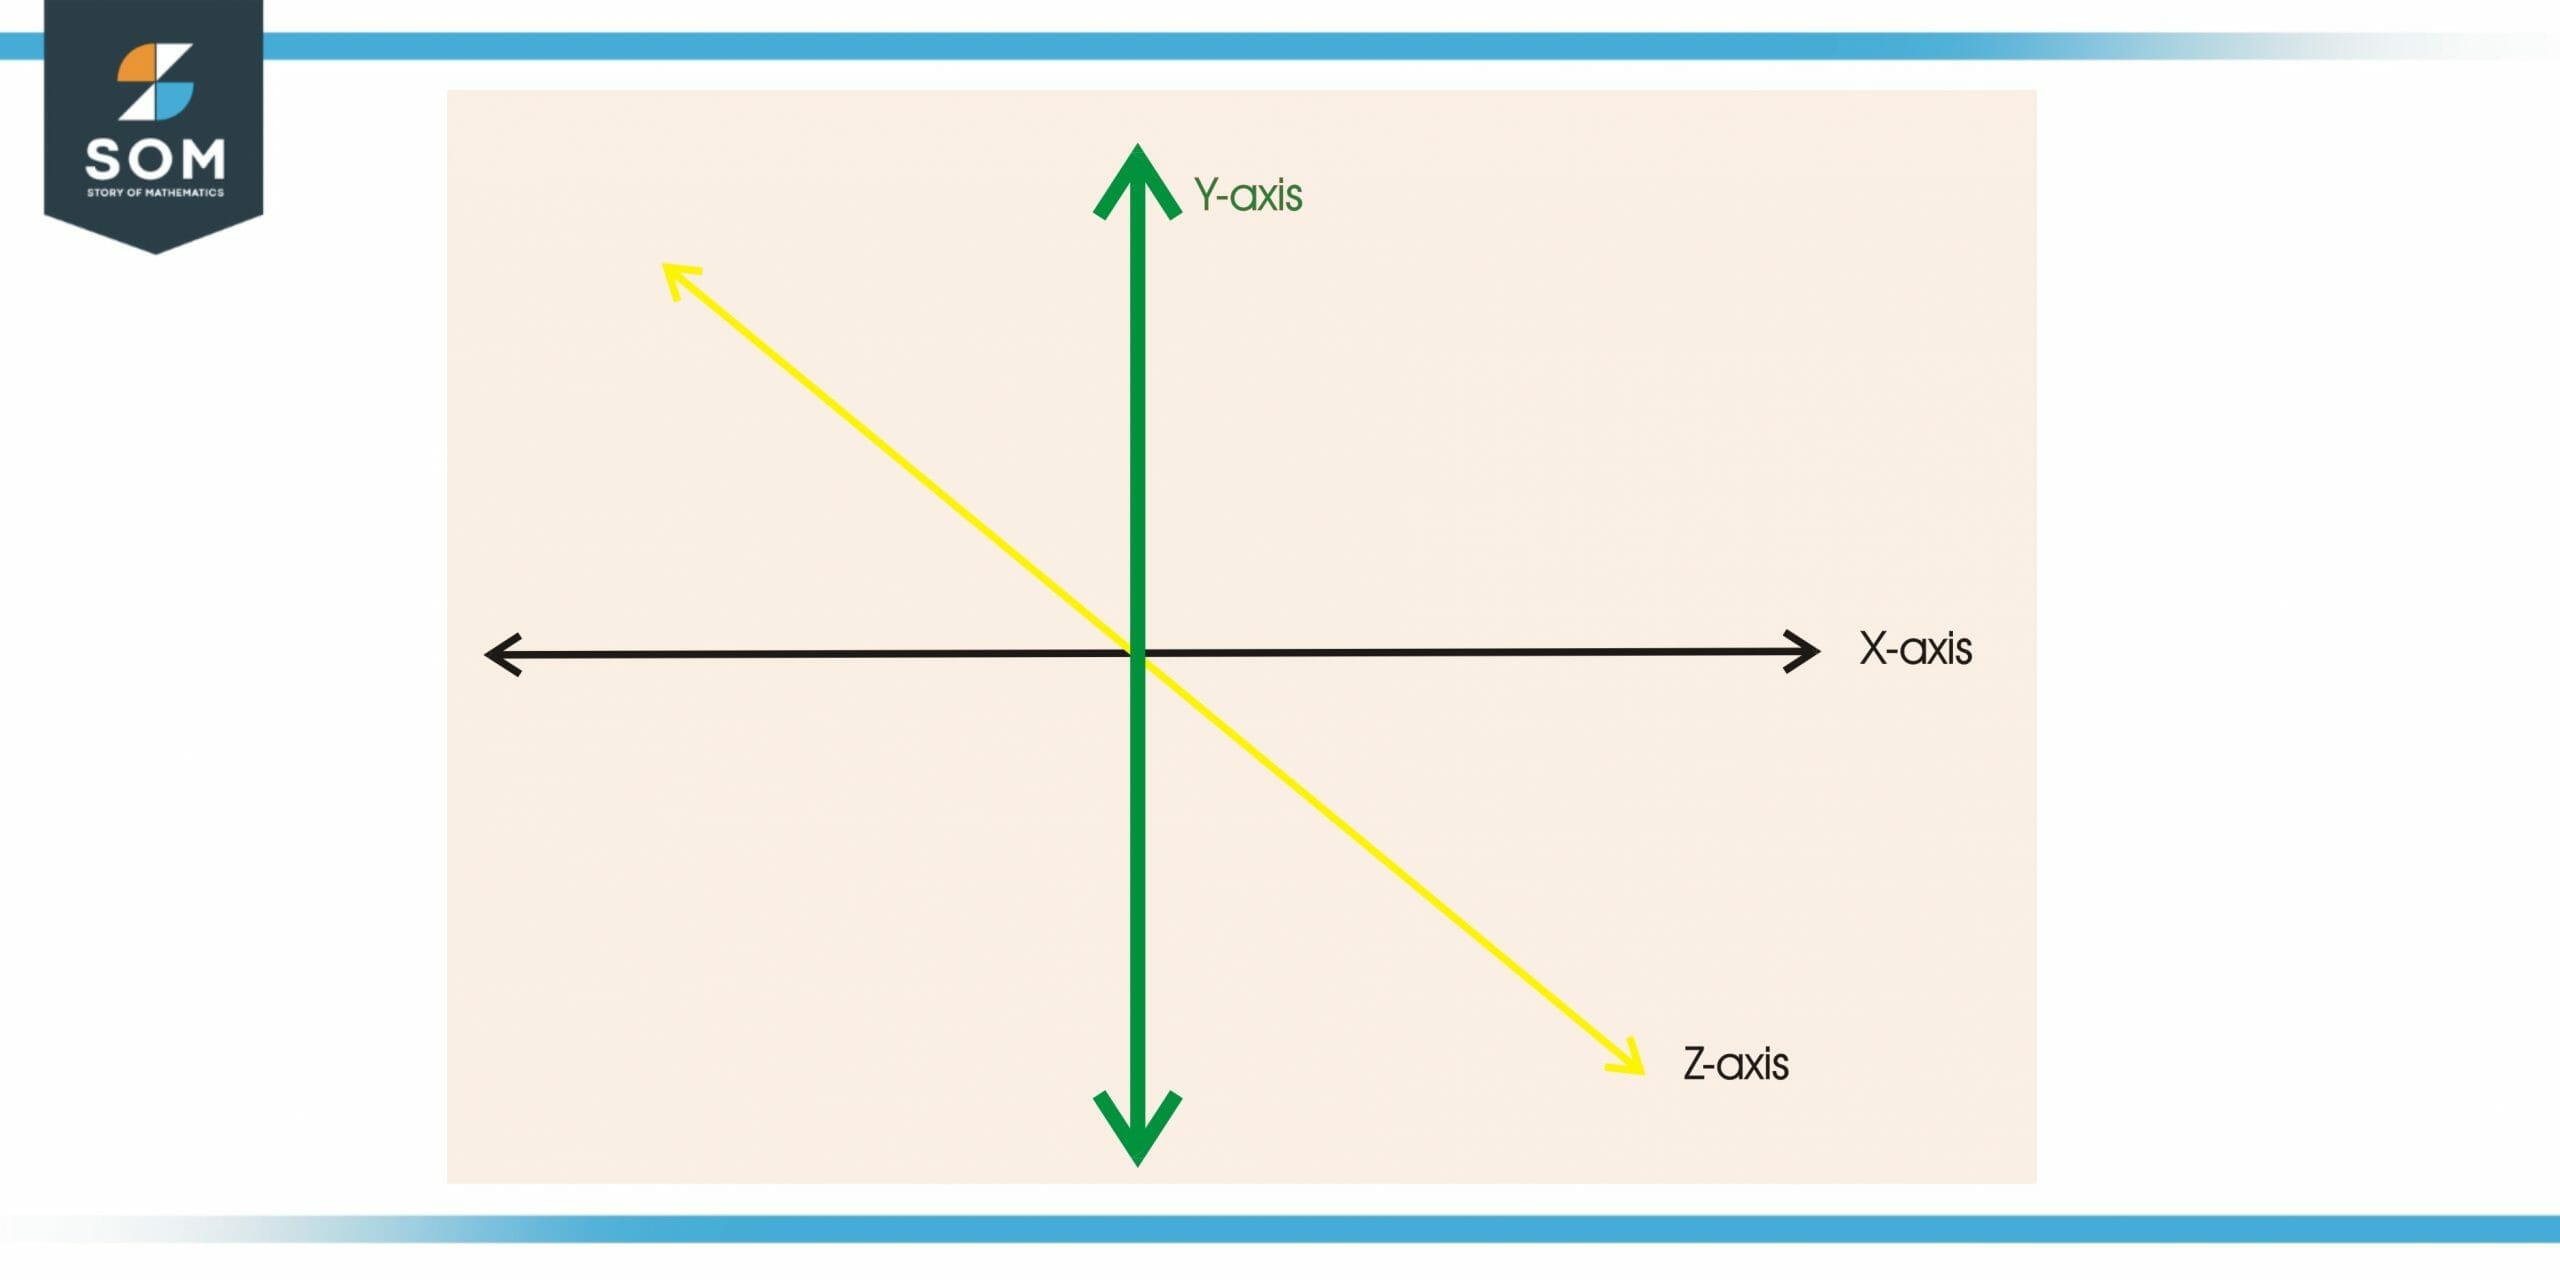
Figure 2 Three-dimensional Representation of Coordinates
What Is a Y Coordinate in the Cartesian Context?
Cartesian coordinates can also be referred to as rectangular coordinates. A coordinate is a point in the form (x, y), where x represents a horizontal position and y represents a vertical position. Specifically, the y-coordinate of a point on a Cartesian plane represents the vertical position of the point relative to the origin.
At the intersection of the horizontal axis and the vertical axis is the origin, which is defined as the point (0, 0) on the graph. For example, consider the following points and plot them on a Cartesian plane: (0, 2), (0, -4), (3, 6), (2, -3), (1, 0)
- To graph (0, 2), you will need to keep the x-axis at zero and move the y-axis up two units.
- Keep the x-axis at zero on and move the y-axis down 4 units to graph (0, -4).
- On the horizontal axis, move 3 units right, then 6 units up when graphing (3, 6).
- Moving 2 units right and down 3 units, we graph the point (-2, -3).
- (1, 0) is plotted by moving one unit to the right without moving a single unit upwards or downwards.
Vertical Distance Measurement
An absolute value of the difference between the y-coordinates of the endpoints of a vertical line segment can be used to determine its length.
How Should I Plot the Data?
It is usually the coordinates (1, 3), (4, 8), and (6, 2) that will be plotted on these graphs since these are the most basic kinds of data. According to the coordinate system, you can measure the x-axis number of the coordinate and the y-axis number of the coordinate along their respective axes.
A graph or grid will always display positive numbers in the upper right-hand corner, which is called a quadrant, whenever they are plotted. Despite this, you may sometimes see graphs where the axes of the graphs show negative numbers on them. Negative numbers follow the same rule; the first is on the x-axis, and the second is on the y-axis.
The following are examples of coordinates and their quadrants
- (-5, 6) This number will be located in the upper left quadrant of the diagram.
- (The number -7, -2) can be found in the lower left quadrant of the diagram.
- In the lower right quadrant, you will find the numbers (5, -7).
Solved Examples
Example 1
Which of the following points lies on the y-axis? (3, 7), (7,3), (0, 3), (0,7), (0,2)
Solution
Only the points with a zero x-coordinate lie along the y-axis. These are:
(0, 3), (0,7), (0,2)
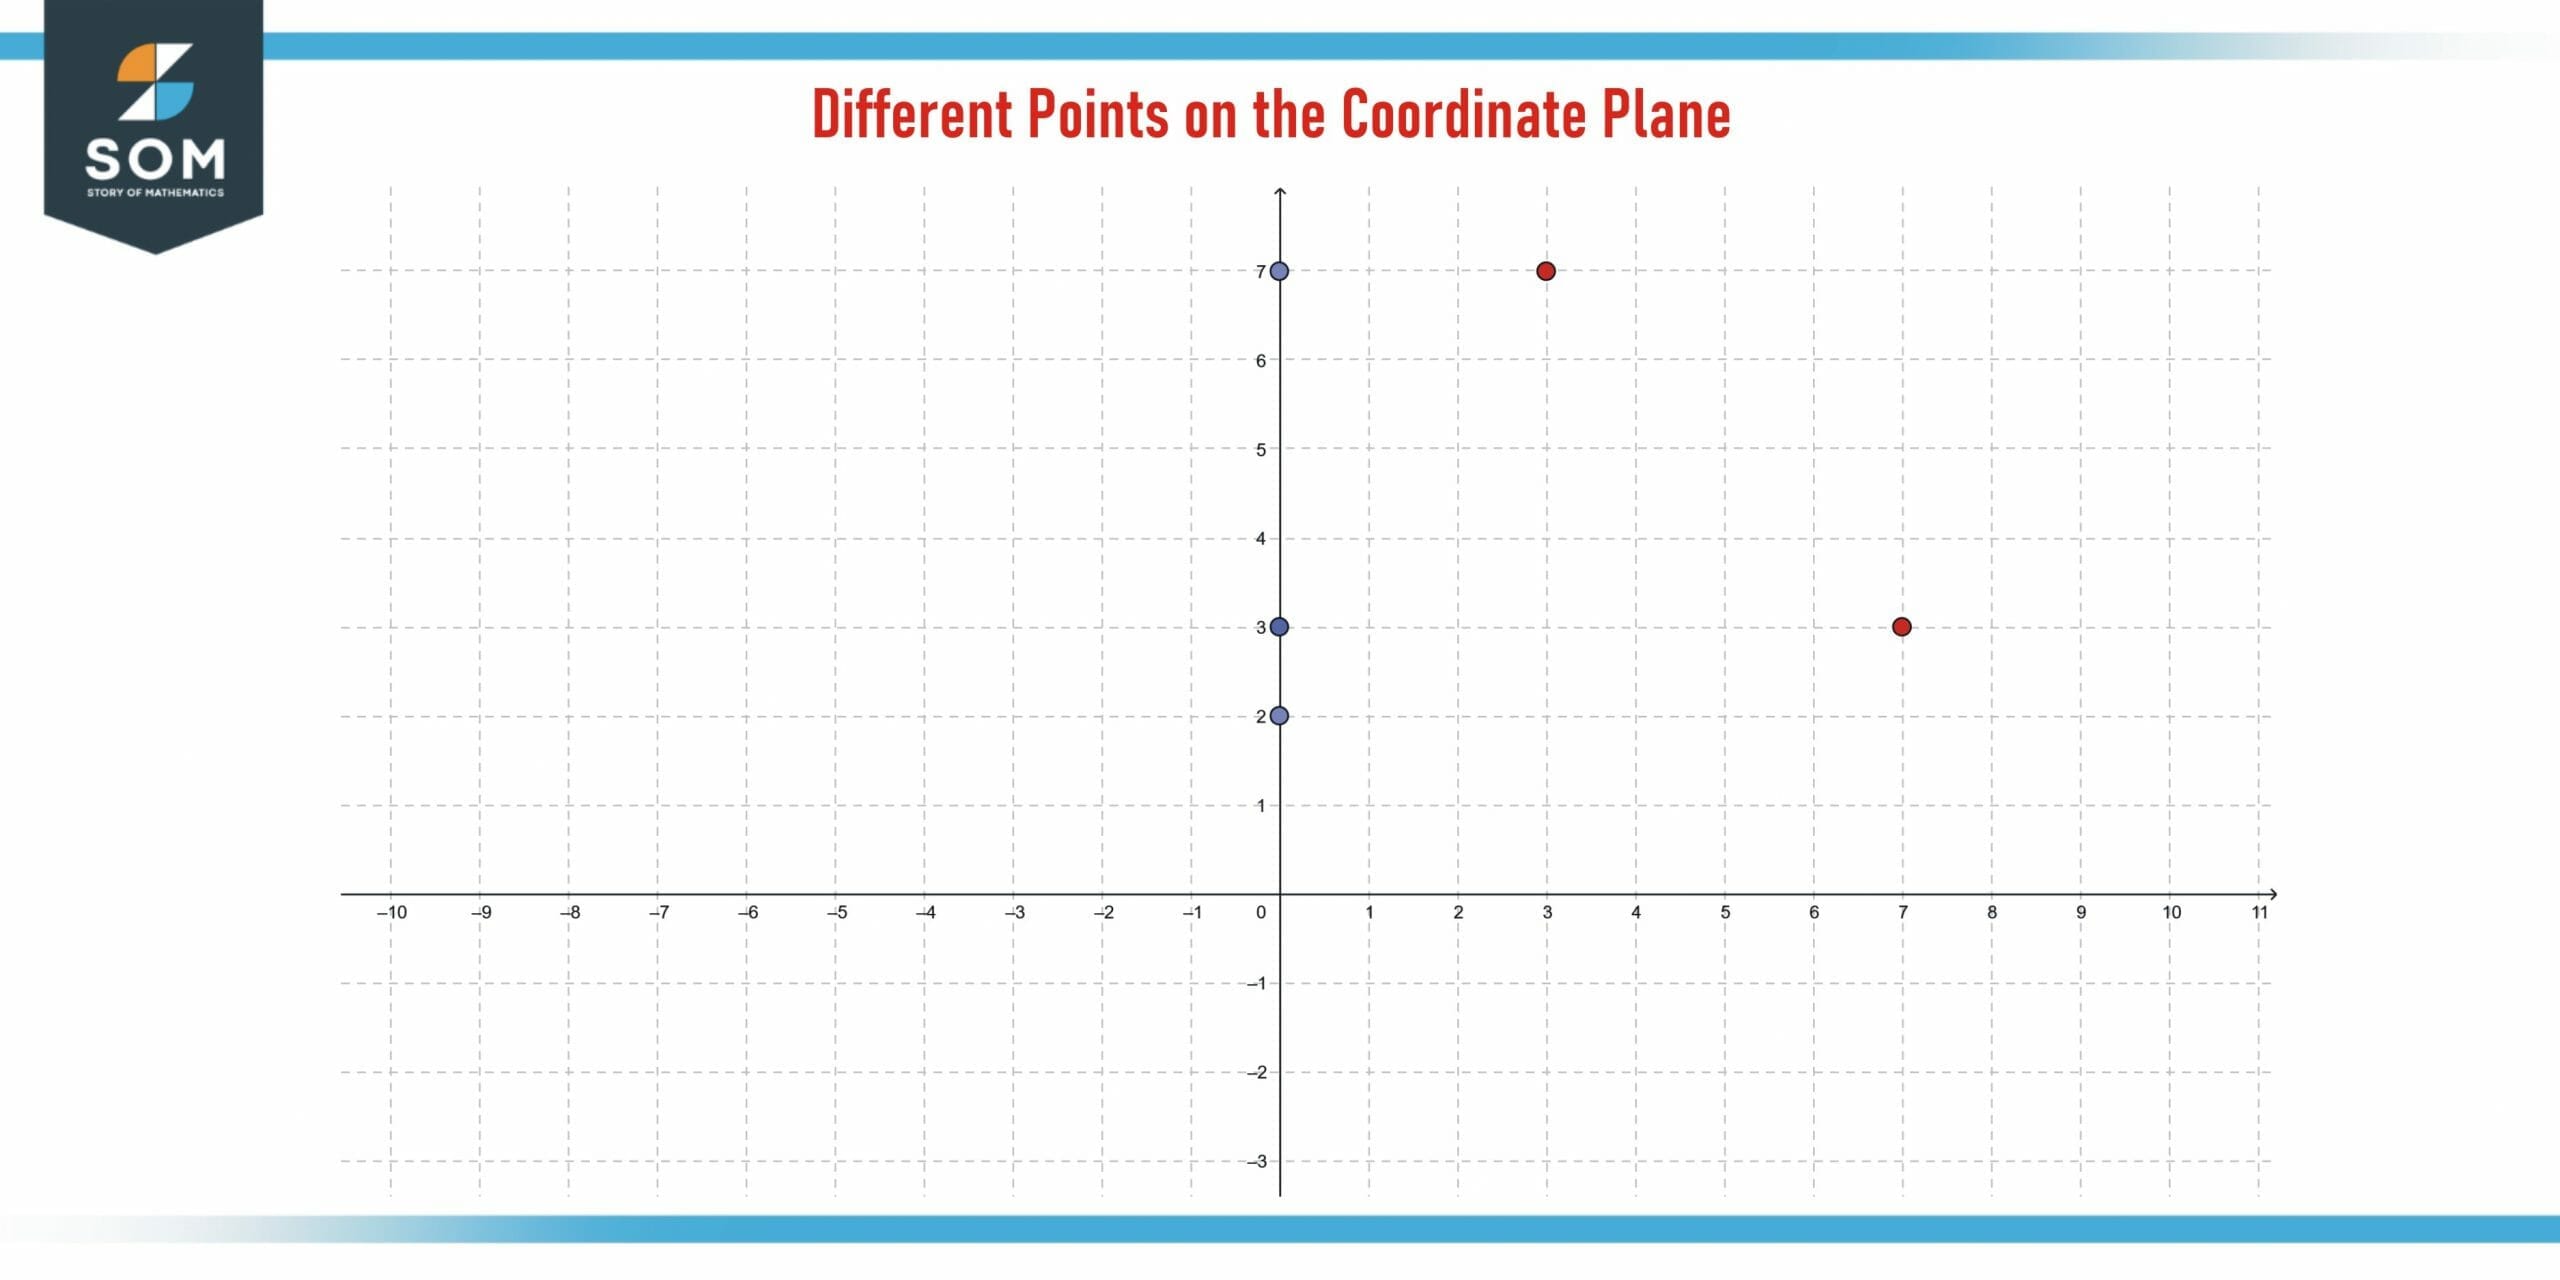
Figure 3 – Different points on a coordinate plane. Blues are on the y-axis.
Example 2
On a coordinate system, draw the points (0,3), (0,5), and (0, -3). Is there a line connecting all the points? What is the name of the line?
Solution
All these points lie along the same line, which happens to be the y-axis because the x-coordinates are all zero.
Example 3
On a coordinate system, plot the points (3,2), (3,4.5), and (3, -3). Is there a line connecting all the points? What is the name of the line?
Solution
This time, instead of 0, all the points have an x-coordinate of 3. Therefore, they all lie along the line x = 3, which is indeed parallel to the y-axis.
All the mathematical images are generated using GeoGebra.