JUMP TO TOPIC
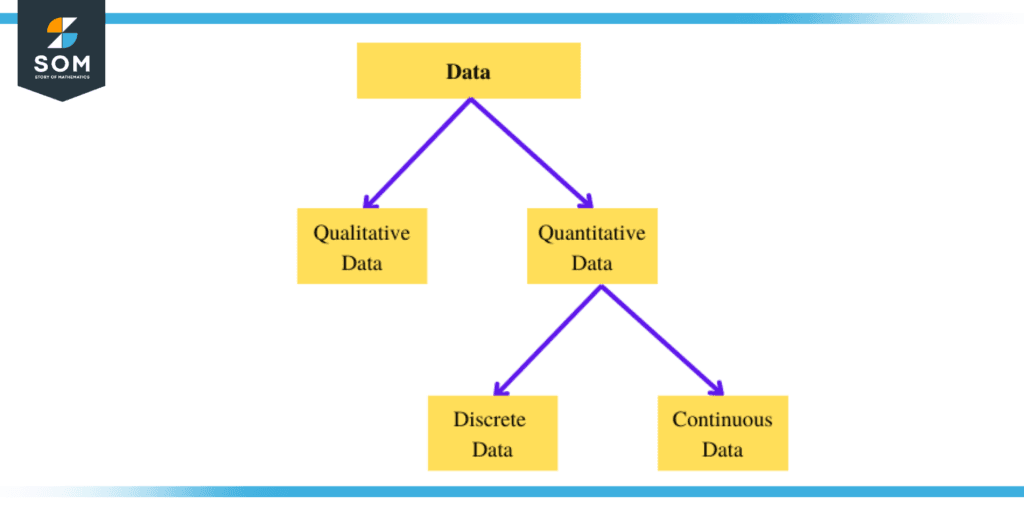
Figure 1: Types of Data
Before we explore continuous data, let us first talk about data. In mathematics, data is a group of related numbers, values, figures, or facts. There are two kinds of data: Qualitative and Quantitative data. Quantitative data is further divided into two types: Discrete data and Continuous data. Discrete data is data that can only be counted and not measured; also, discrete data cannot be divided further into smaller sub-data parts. This classification of data is illustrated below.
Now let us come back to our topic: continuous data. A continuous data set is a representation of a kind of measurement that not only includes whole numbers but also takes into account fractions and decimals. When dealing with continuous data, precision is the most important factor. These data sets typically contain variables that have decimal places in them. In continuous data sets, values such as height, weight, length, temperature, and other comparable metrics would be included. These are things that could be measured using fractions and decimals, respectively.
To generate the numbers for continuous data collection, one will often need to make use of measuring devices, such as a yardstick, tape line, scale, weighing balance, or other similar instruments. These numbers are usually not as organized and fine as the numbers that are found in discrete data because of the fact that they are typically obtained from accurate measurements. However, measuring a certain topic throughout the course of time gives us the ability to construct a particular range within which we may anticipate collecting additional data.
Characteristics of Continuous Data
When analyzing continuous data, as opposed to discrete data, one must utilize advanced statistical analysis methodologies while also taking into consideration an infinite number of possible values. Below are some key characteristics which distinguish continuous data from discrete data
(a) We do know that continuous data sets are the ones that can be quantified. Thus, in order to generate the numbers, continuous data collection almost always demands the utilization of an instrument, such as a Speedometer, tape line, weighing balance, thermometer, or any other similar instrument.
(b) Continuous data are comprised of random values that can be whole numbers and can also be fractions. These numbers have their own unique significance and can be subdivided further and further into smaller components. There is an infinite number of probable values that can be found within a range.
(c) The values of continuous data can be different at different points in time and, therefore, may also change throughout the course of time.
(d) When displaying continuous data, methods such as line graphs, skews, histograms, and others from the field of data analysis is utilized. Regression analysis is widely considered to be one of the most useful methods for analyzing continuous data.
(e) The use of continuous data is efficient; even a tiny amount of data can disclose a significant lot regarding the data being examined. The mean or standard deviation of continuous data can be determined using descriptive statistics, which could be used to describe the data.
Real-life Examples of Continuous Data
Below are a few examples illustrating continuous data sets, which are representations of a kind of measurement which involves fractions and decimal numbers in addition to whole numbers.
(1) The average height of the kids attending any school.
(2) The duration of the movies.
(3) The velocity of a car.
(4) The total land area comprised of the residential properties that are owned by a particular society.
(5) The mass of a just-born child.
(6) The duration of time it takes for people to commute to their places of employment.
(7) Temperature in degrees Celsius inside any room.
(8) The blood pressure readings observed from hospitalized individuals.
(9) The length of time it takes competitors to complete the race.
(10) The amount of water or any other liquid contained in a particular tank
And we can see several more such examples around us. Keep in mind that in order for data to be considered continuous, it must be able to be quantified using decimals and fractions.
Example Problems on Classifying Data
Example 1
George caught seasonal flu. Upon visiting his doctor, he was advised to take medicines and measure his body temperature for the next five days. We know that, by definition, this temperature record can be called data. Find and explain what kind of data set this record of temperature is.
Solution
As we have discussed already that continuous data is one that can be quantified or measured. Furthermore, continuous data can also be expressed in the form of decimals as well as whole numbers. In the above example, the data gathered by George is his body temperature. Temperature, as we know, is a measurable quantity and is often expressed in decimals. Since discrete data is neither measurable nor can it be expressed in decimals. Therefore, this temperature record is continuous data.
Example 2
A list of different kinds of data sets is given below. Find out Which of them are continuous data sets and explain why it is so.
(a) Number of shoe pairs owned by each member of a household {3, 2, 1, 4}.
(b) Masses of just-born children in a hospital {5.2 lb, 6.3 lb, 8.2 lb, 7.5 lb}.
(c) Number of students sitting in each row of a class {5, 7, 9, 6}.
(d) The amount of time taken by runners to complete a 100-meter race {16 s, 18.2 s, 15.7 s, 14.9 s}.
Solution
Among the above-given data sets, (b) and (c) data sets are continuous data sets. In (b) data set, masses of just-born children are given, which are both measurable and can be expressed in decimals. It is illustrated in a histogram below.
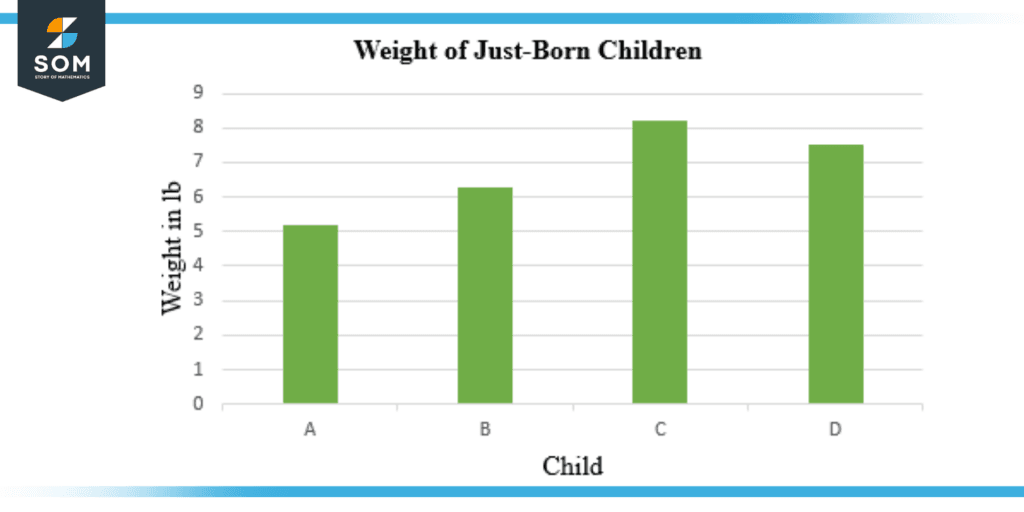
Figure 2: Illustration of Example 2 (b)
Similarly, in (d) data set, the amount of time taken by runners to complete a 100-meter race is given, which is again a data set that can be quantified and expressed in decimals. Whereas the remaining two are countable and not measurable data sets. It is illustrated in a histogram below.
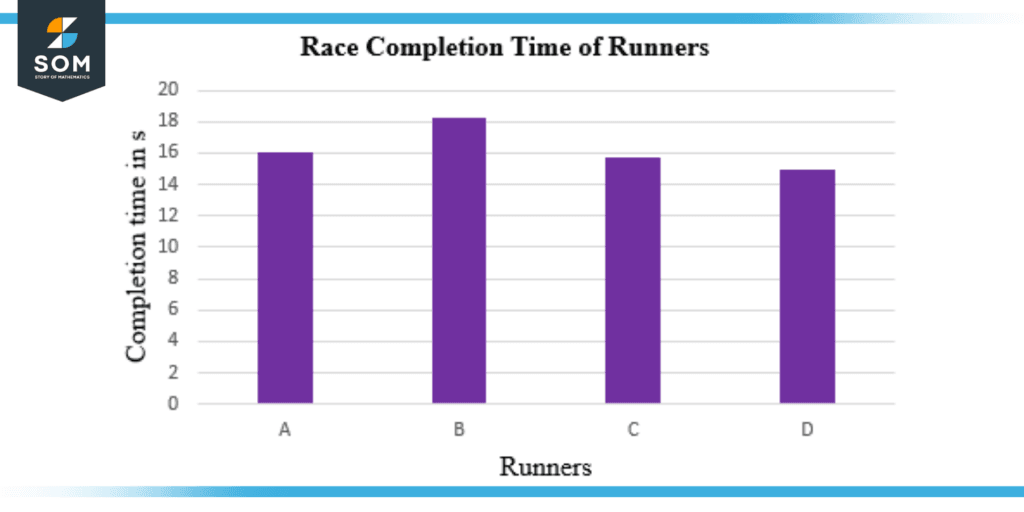
Figure 3: Illustration of Example 2 (d)
All images/mathematical drawings were created with GeoGebra.