JUMP TO TOPIC
The term “extrapolation” refers to an assessment of a price based on expanding the existing series or components outside the region that is unquestionably known. In other words, extrapolation is a technique where the data values are treated as points, such as x1, x2, …, xn.
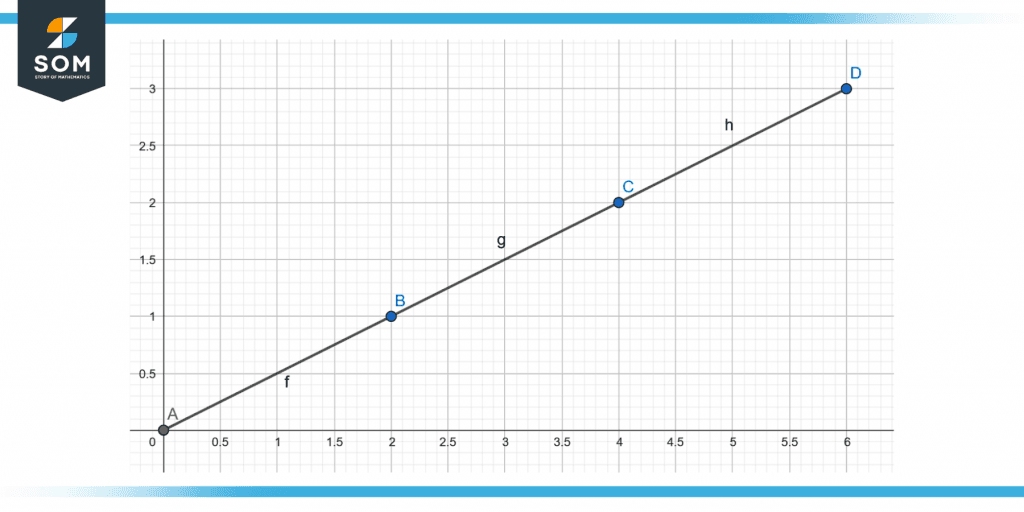
Figure 1 – Extrapolation graph of x = 2y.
If statistical data is periodically sampled and resembles the next data point, it frequently appears in that data. One such instance is how you often extrapolate the state of the roads while driving.
Figure 1 above shows the extrapolation graph of x = 2y.
Extrapolation Statistics
A statistical extrapolation technique aims to interpret the unseen data from the existing data. It uses previous data to attempt to anticipate future data. For instance, it uses the current population and growth rate to project the sample size in a few years.
Extrapolation Formula
Consider the two ends of a linear graph, (x1, y1) as well as (x2, y2), from which the number of the point “x” is to be extrapolated. The extrapolating formula is then given as
\[ \mathsf{y(x)=y_{1}+\frac{x-x_{1}}{x_{2}-x_{1}}(y_{2}-y_{1})} \]
Extrapolation Methods
Three categories of extrapolation exist, including
- Linear extrapolation
- Extrapolation Using Polynomials
- Conic extrapolation
Discussing each one of them in detail.
Linear Extrapolation
The process of linear extrapolation is drawing a tangent line
When the point to be projected is not too distant from the provided data, linear extrapolation produces a decent result for any linear function. Typically, this is accomplished by drawing a tangent at the terminus of the provided graph that is stretched past the limit.
Extrapolation Using Polynomials
Polynomial extrapolation is often done using Lagrange interpolation or Newton’s technique of finite differences, To produce a Newton series that matches the data. Polynomial curves can be generated with all available data or data close to the ends.
The data for this approach is often provided via Newton’s system of limited series or Lagrange interpolation. The information is extrapolated using the related endpoints and the final polynomial.
Conic Extrapolation
Conic extrapolation is constructed near the conclusion of the given data. Five points can be used to construct a conic section when extrapolated, and a produced conic section that is an ellipse and circle reconnected to itself.
An expanded parabola or hyperbola could curve back toward the X-axis rather than rejoining itself. A computer and a conic section template might be used for this extrapolation.
Five locations closer to the conclusion of the supplied (i.e., known) data can be used to form a conic section. If the conic section is a circle or an ellipse, it will loop back on itself. The curve won’t reverse for a parabola or hyperbola, though, because they are relative to the X-axis.
French Curve Extrapolation
Any distribution that tends to be exponential but has accelerating or decelerating components is eligible for French curve extrapolation. Since 1987, and for a while prior, this approach has been used effectively to provide projected forecasts of the spread of HIV/AIDS within the UK and mutant CJD. According to other research, extrapolation can yield more accurate findings than those from more sophisticated predicting techniques.
Extrapolation Graph
Extrapolation, as we are all aware, is estimating the data point at the curve’s periphery when just a few moments are available. The known data in the case below are a, b, and c. Extrapolation point identification involves finding the point d.
Figure 2 below shows a graphical representation of extrapolation.
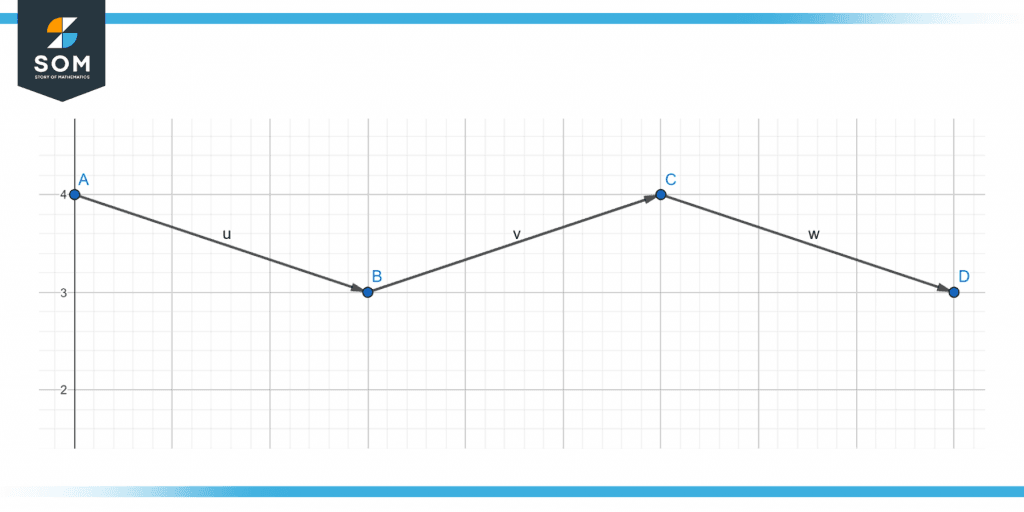
Figure 2 – Graphical representation of extrapolation.
Geometric Extrapolation With Error Prediction
This sort of extrapolation, which may be made with three points from a sequence and an “index” or “moment,” has 100% accuracy in forecasts for a significant portion of known series databases.
Figure 3 below shows the geometrical explanation of extrapolation.
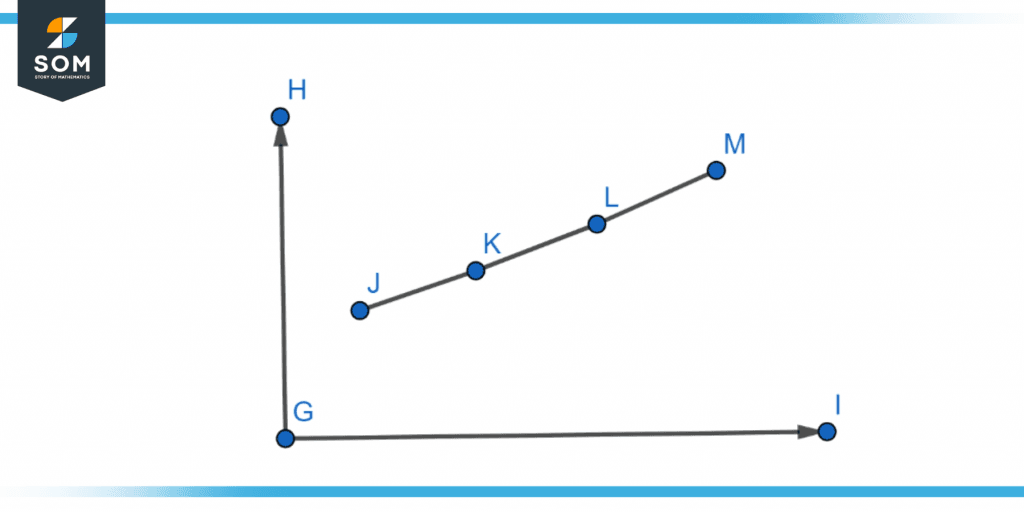
Figure 3 – Representation of geometric extrapolation.
Extrapolation Arguments
Extrapolation arguments, informal and unsupported by evidence, claim that something is likely true regardless of values beyond the known range for which it is true.
For instance, we think that what we see with magnifying glasses is genuine because it coincides with what we perceive with the naked eye but goes beyond it. Likewise, what we see with light microscopes is real since it coincides with what we see using magnifying glasses but goes beyond it.
These justifications are frequently employed in biology when extending findings from animal research to people and from small-scale investigations to a larger population.
Extrapolation arguments can be strong or weak, similar to slippery slope arguments, depending on various criteria, including how far the extrapolation extends beyond the known range.
Examples of Extrapolation
We will look at some solved examples of extrapolation to understand the concept further.
Example 1
The two supplied points are (1, 2) and, on a straight line, (3, 4). Applying the linear extrapolation technique, assess the value of y just on a straight line at x = 5.
Solution
Given:
x1 = 1 , y1 = 2 , x2 = 3 , y2 = 4
We know that the linear extrapolation formula is:
\[\mathsf{y(x)=y_{1}+\frac{x-x_{1}}{x_{2}-x_{1}}(y_{2}-y_{1})} \]
Replace the specified values with the known values:
y(5) = 5 + [(5 – 1) / (3 – 1)](4 – 2)
y(5) = 5 + (4/2)(2)
y(5) = 5 + 4
y(5) = 9
Therefore y(5) is equal to 9.
Example 2
Suppose we are given two points (1,7) and (2,8) on a straight line. Using the linear extrapolation technique, find the value of y on the straight line at x = 9.
Solution
Given:
x1 = 1 , y1 = 7 , x2 = 2 , y2 = 8
We know that the linear extrapolation formula is;
\[\mathsf{y(x)=y_{1}+\frac{x-x_{1}}{x_{2}-x_{1}}(y_{2}-y_{1})} \]
Replace the specified values with the known values:
y(9) = 9 + [(9 – 1) / (2 – 1)](8 – 7)
y(9) = 9 + (8/1)(1)
y(9) = 9 + 8
y(9) = 17
Therefore y(9) is equal to 17.
All images are made using GeoGebra.