JUMP TO TOPIC
A trend is a line that is decided to add to the scatter plot to show the generalization of all data. Consider this same scatter plot employed here explanation to depict a trend line.
The following figure 1 shows a trend line.
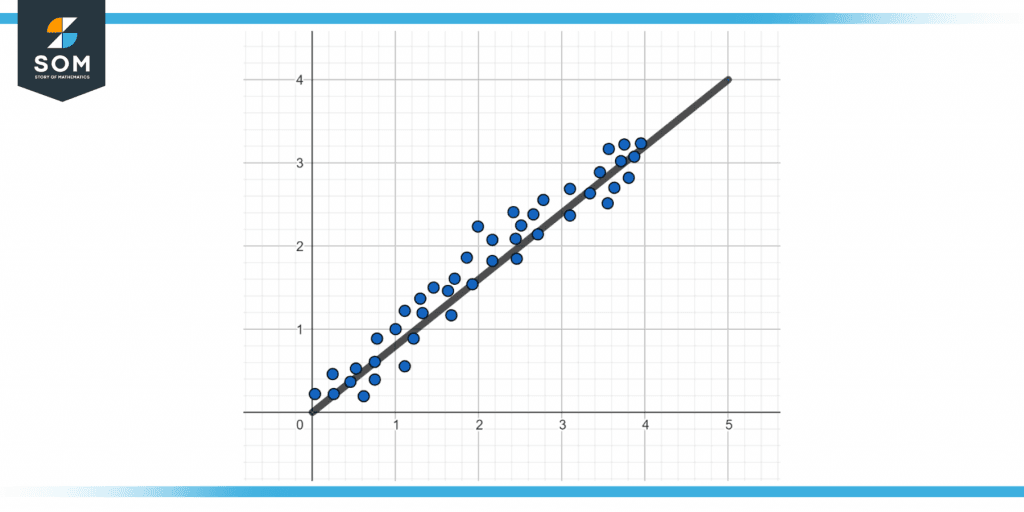
Figure 1 – Representation of a trend line.
What Exactly Is a Trend Line?
A trend is a line drawn on a graph to depict a pattern or trend. Is it implied by the meaning of the trend line that there has always been a trend? No, there is not always a trend, but a trend line, also known as a best-fit line, will help identify and quantify any existing trend.
A trend line and a line graph are not the same things. It is not built by merely adding points but by determining even if there isn’t a pattern.
Predictions can also be made using trend lines. Using a trend line could aid in predicting future or unidentified values.
In real life, how and where are trend lines used? In many real-world situations, trend lines are used. Here are a couple of examples:
- A trend line can demonstrate an upward or declining direction in stock prices. The values vary throughout the day, but a trend line can reveal an overall pattern.
- Similar to stock prices, a trend line could show the upward or decreasing movement in home prices. Although the values may not rise or fall linearly, a trend line may reveal an overall pattern.
- Sales patterns that are increasing or decreasing.
- Weather patterns that increase or decrease, such as air temp or precipitation.
- Trends in sports statistics that increase or decrease, such as a tendency of higher total point totals in pro basketball games.
- The list can go on forever. Trend lines can help you find patterns inside the connection between two variables and predict the future.
Using a Trend Line to Interpret
What is the best way to analyze or understand a trend line? Note that a general trend might help you spot a pattern in the relationship between two variables. Looking at the direction of the trend line might help understand the variables’ associations:
- A trend line with a positive slope suggests a correlation. They expand or contract together.
- A negative slope on the overall trend indicates that the two factors have a negative association. When one goes up, the other goes down, and vice versa.
- A general horizontal trend with a gradient of 0 implies that the two components are inextricably linked.
Graph of Positive Trend
A positive trend chart has a positive slope on the trend line. This indicates that the variables have a positive relationship, which implies those who increase or decrease around each other.
The amount a person pays in federal taxes rises in proportion to their total income. This is an example of a graph with a positive trend. Although there are some variances in the values, the general trend is positive. This graph’s estimated trend line has a positive slope.
Graph of Negative Trend
A negative system to measure is one with a trend line with a negative gradient. This indicates an inverse relationship between the variables, which means that when one rises, the other falls, and vice versa.
The value of a car decreases as it gets older. This is an illustration of a harmful trend graph. Despite a few fluctuations inside the values, the global pattern is negative. This graph’s estimated trend line has a negative slope.
Figure 2 below shows a negative trendline.
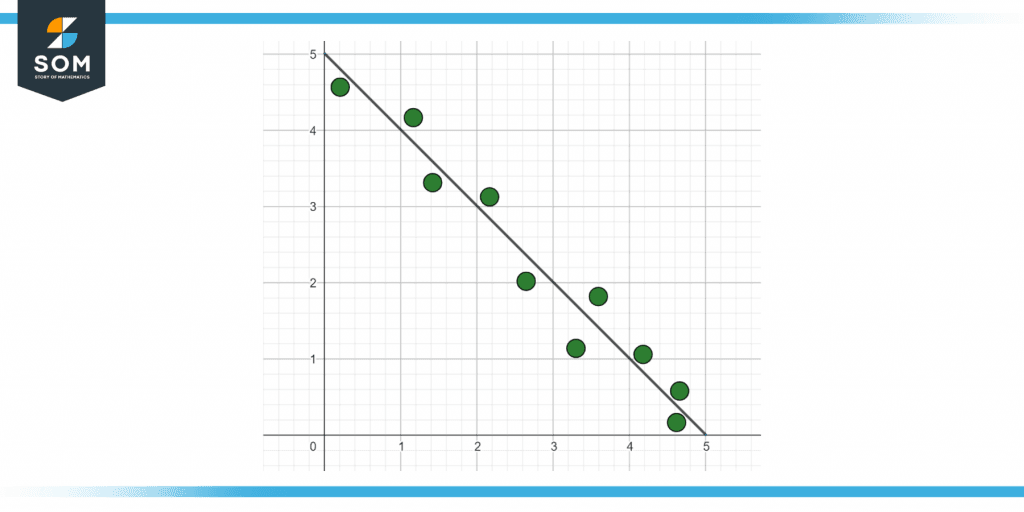
Figure 2 – Representation of a negative trend line.
Is There a Pattern to All Relationships?
No, not all relationships have a trend line. Scatter plots are commonly used to create trend lines. What exactly is a scatter diagram? A scatter plot is a chart that depicts the connection between two variables as a series of points.
These data points could or might not indicate a trend. The x-axis is the number of letters in a human’s first name, and the y-axis is the number of water cups the person drank yesterday.
These same points are not arranged in any pattern but are rather randomly distributed. There is no link between the value of letters in such a person’s 1st name and the value of water cups consumed yesterday.
Figure 3 below shows a scatter plot.
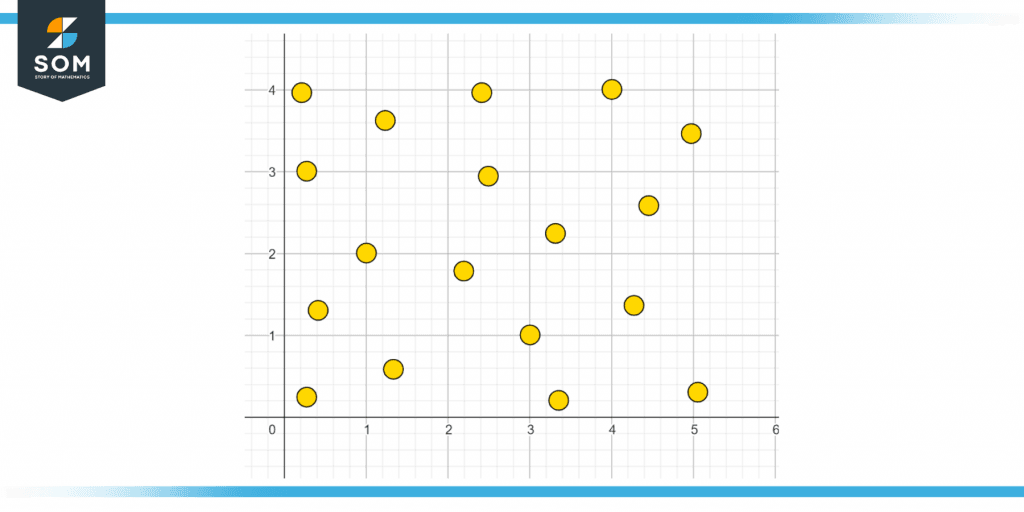
Figure 3 – Representation of a scatter plot.
Including Trend Lines in Graphs
A trend line (often known as the best-fit line) is a line that we add to a chart to highlight the overall direction in which points appear to be moving.
Consider a “trend” to be a mathematical pattern. A trend is any form you notice on a chart or among data points. The trend line is something we put to the graph to help the pattern stand out even more.
Example of Trend Line
A scatter plot has four points (6,2), (2,5), (5,6), and (7,3). Find the line that passes through them.
Solution
We first take the sum of all the X and Y values to find the line passing through these points. This gives us the following:
Sum of X = 20
Sum of Y = 16
Now we can find the mean values for both X and Y. This is done by dividing the sums of X and Y by the number of points. We get the following means:
Mean of X = 5
Mean of Y = 4
Then we find the sum of squares which is = 14, along with a sum of products which is = -7.
Using the equation y = mx + c. We can find the line passing through the points where m = $\frac{Sum of Products}{Sum of Squares}. We get m = -0.5.
We calculate c, which is 6.5. This is done by using m and taking values of X and Y from the points.
We get the following line equation:
y = -0.5X + 6.5
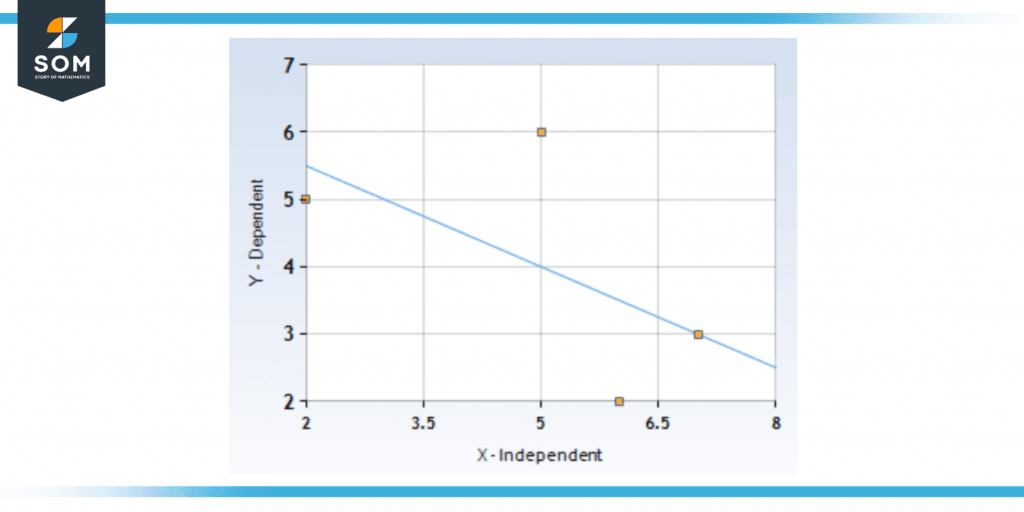
Figure 4 – Solution of a trend line.
All images are made using GeoGebra.