JUMP TO TOPIC
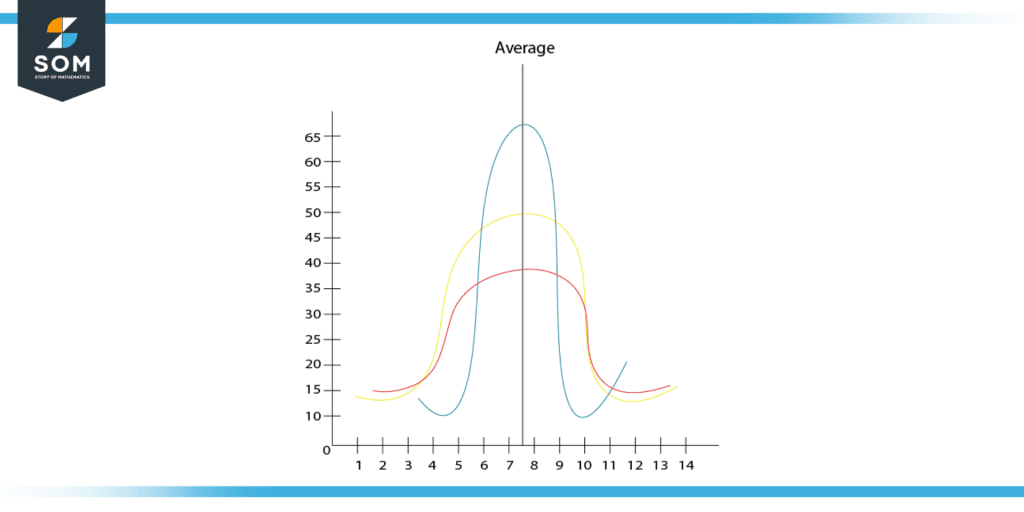
Figure 1: Graphical representation of variance.
The variance is determined as the sum of the squared deviations from the mean of each data point divided by the number of data points. The equation looks like this:
Variance = Σ(X – μ)2 / N
Where X is a single data point, is the data set’s average, and N represents the total number of data points in the set.
Importance of Variance
When analyzing data distribution and forecasting upcoming data points, variance can serve as a useful tool. For instance, a significant variance in a group of stock prices may be a sign of high market volatility, but a little variance may be a sign of stability.
As values that deviate greatly from the mean are likely to be viewed as outliers, variance can also be used to spot outliers or abnormalities in a data set.
Properties of Variance
The characteristics of variance consist of the following:
- Non-Negativity: Variance is never negative, which means it can never be less than zero. Since the sum of squared deviations from the mean, which is always positive or zero, is used to determine variance, this is the case.
- Zero for constant data: If there is no dispersion in the data and all the values in a dataset are the same, the variance will be zero.
- Units: Because variance is expressed as the data’s squared units, it might be challenging to understand. The standard deviation, which is the variance’s square root, is frequently employed to make variance more understandable.
- Sensitivity to extreme values: Variance can be sensitive to extreme values and can occasionally be altered by their presence.
- Linear transformations: When a linear transformation is done to a dataset, the variance is altered by a nominal quantity. The variance will be multiplied by a constant, for instance, if a dataset is multiplied by that constant.
- Additivity: The variance of two independent datasets added together equals the variance of the independent datasets added separately.
- Independence: The total of the variances of the independent random variables in a linear combination is the variance of the linear combination.
- Consistency: The sample variance approaches the population variance as the sample size grows.
Uses of Variance in Different Areas
Variance is useful in many different applications, including:
- Analysis of the distribution of data: Variance, which analyzes the dispersion between the particular values in a dataset, makes it possible to better comprehend the distribution of data.
- Finding outliers: Because values that differ significantly from the mean are likely to be regarded as outliers, variance can be used to find outliers or extreme values in a data set.
- Significance of differences: Variance can be used to examine the significance of differences between two groups or to establish whether a relationship between two variables is true or the result of chance in hypothesis testing.
- Regression analysis: Regression analysis makes forecasts of future values based on the regression equation and makes use of variance to assess the strength of the link between variables. Variance can be used in regression analysis to assess the strength of the link between variables and to forecast future values using the regression equation.
- Portfolio optimization: Variance is applied in portfolio optimization in finance to assess the level of risk in an investment portfolio and to choose a portfolio that is both well-diversified and has a manageable level of risk.
- Quality control: Variance can be utilized in quality control in engineering and manufacturing to assess a process’ consistency and pinpoint opportunities for development.
- Experimental design: Variance can also be used in experimental design in scientific research to ascertain the effects of various treatments or conditions on a response variable and to draw conclusions about population parameters.
- Hypothesis testing: Variance can greatly be useful in hypothesis testing as well as other statistical procedures, in addition to helping us understand how data are distributed. For instance, variance can be used in hypothesis testing to determine the importance of differences between two groups or to establish if a correlation between two variables is causal or coincidental.
Types of Variance
Variance falls into two categories: sample variance and population variance. In contrast, to sample variance, which is an assessment of the variance in a sample of data collected from a population, population variance is a measure of the variance in the entire population of data. Population variance is calculated as follows:
Var(pop) = Σ(X – μ)2 / N
while the formula for sample variance can be written as:
Var(samp) = Σ(X – x̄)2 / (N-1)
Variance and Standard Deviation
The concept of standard deviation, which is the square root of the variance, is similarly related to variance. Given that it is given in the same units as the data points, the standard deviation is a more understandable way to assess spread.
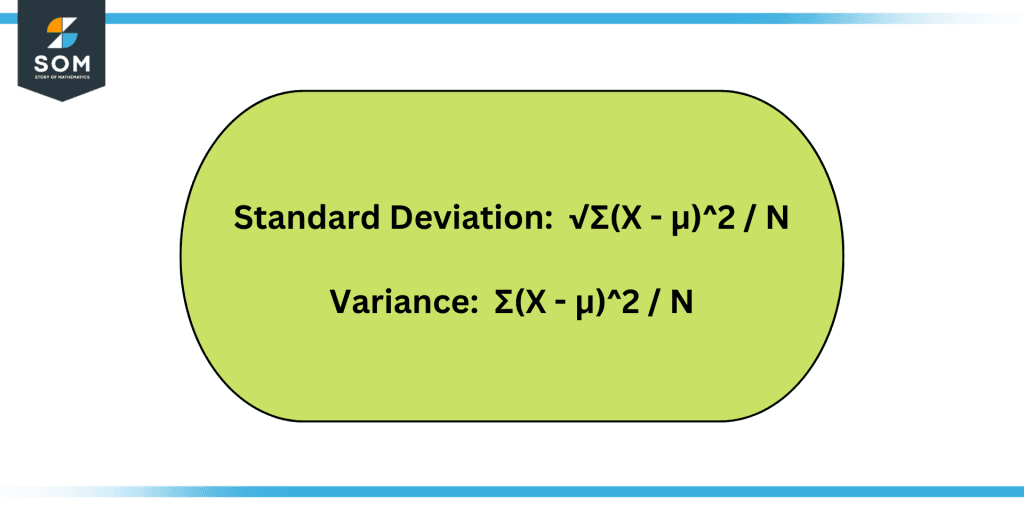
Figure 2: Formulas for standard deviation and variance.
The square root of the variance is used to determine the standard deviation, which is represented as follows:
Standard Deviation = √Variance
The range of values that are most inclined to lie within a particular number of standard deviations from the mean can be determined using standard deviation. For instance, a normal distribution has data that falls roughly 68% of the time within one standard deviation of the mean and 95% of the time within two standard deviations.
Sensitivity of Variance
It is crucial to remember that variance can be susceptible to outliers and extreme values and that their presence can occasionally have an impact on variance. This may result in erroneous interpretations of the data distribution and skewed predictions in statistical models.
In order to address this problem, researchers frequently change the data to lessen the impact of outliers or use alternate measurements of dispersion, for instance, the median or interquartile range.
Summary
- As a statistical measure of the variation in numbers within a collection of data, a variance is a crucial tool in many domains for interpreting data distribution and making predictions.
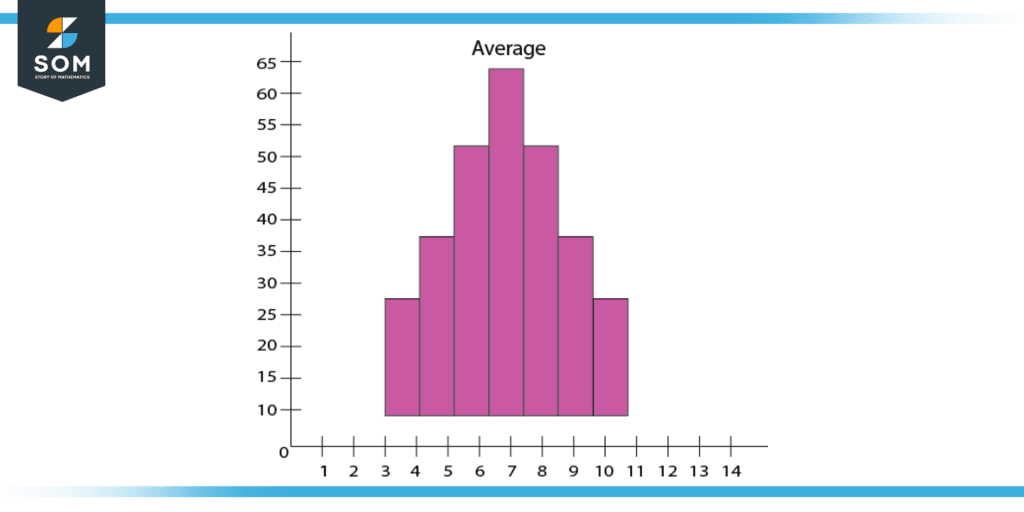
Figure 3: Dispersion of data from the mean value.
- Instead of employing more extensive mathematical techniques like grouping the data set’s numbers into quartiles, statistics use variance to discover how distinct numbers correlate to one another.
- Variance takes into account that all departures from the mean, regardless of their direction, are the same. The squared deviations, however, cannot add up to 0 and show that there is absolutely no variability in the provided data set.
- Finding variance has the drawback of giving combined weight to extreme results or numbers that deviate greatly from the mean. There is a possibility that squaring these numbers will distort the available data set.
- The fact that variation occasionally results from sophisticated calculations is another drawback.
Examples Explaining the Concept of Variance
Example 1
Consider the following heights: 715, 360, 120, 220, and 175 millimeters. Find the variance.
Solution
Mean and Variance are related terms. Finding the mean is the first stage, which is done as follows:
Mean = ( 715 + 360 + 120 + 220 + 175) / 5 = 318
Therefore, the median is 318 mm.
Determining the difference between each term and the mean value will be the next step.
715 – 318 = 397
360 – 318 = 42
120 – 318 = -198
220 – 318 = -98
175 – 318 = -143
Calculate each individual deviation from the mean, square it, and then find the average once more to determine the variance.
The variance in this situation is, therefore:
= (397)2 + (42)2 + (-198)2 + (-98)2 + (-143)2 /5 = 228630/5
The final answer is Variance = 45726.
Example 2
Calculate the population variance of the following data:
1.5, 2.6, 3.7, 4.8
Solution
Let us calculate the mean of the data in the first step:
Mean = (1.5 + 2.6 + 3.7 + 4.8) / 4 = 3.15
Population Variance = Σ(X – μ)2 / N
Now, we will find the difference between each term in the data set and the mean value:
1.5 – 3.15 = -1.65
2.6 – 3.15 = -0.55
3.7 – 3.15 = 0.55
4.8 – 3.15 = 1.65
The final answer will be:
= (-1.65)2 + (-0.55)2 + (0.55)2 + (1.65)2 /4
= 6.05/4
= 1.51
All the images/mathematical drawings were created using GeoGebra.