JUMP TO TOPIC
Definition
Any statistical relationship that occurs between two random variables or bivariate data, whether causal or not, is termed a correlation, or dependence, in the field of statistics.
It measures how much the values of one variable affect the values of others, which can simplify analysis.
What Is Correlation?
This section covers the calculation and interpretation of correlation coefficients on ordinal and interval-level scales. A correlation coefficient is a number that may be derived from many correlation methods . This number summarizes the link that exists between two variables. The sign r typically denotes the correlation coefficient, which can vary from minus one to plus one.
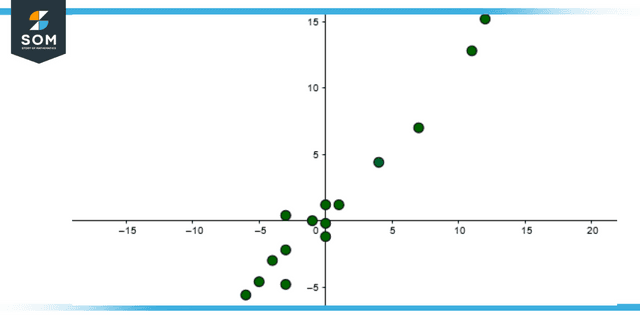
Figure 1: Representation of Positive Correlation
If the correlation coefficient exists near zero but is either positive or negative, this indicates that there is little to no relationship between the two variables. A correlation coefficient near to being positive 1 indicates a positive association between the two variables and that increases in one of the variables are connected with rises in the other variable.
A correlation coefficient that exists near -1 implies a negative link between the two variables being examined. Specifically, an increase in one of the variables is related to a drop in the other variable.
The production of a correlation coefficient is possible for variables that are measured on an ordinal, interval, or ratio level; however, this coefficient has very little relevance when applied to variables that are measured on a scale that is little more than nominal.
Spearman’s rho can be used to determine the correlation coefficient for ordinal scales, which is helpful for research. Pearson’s r, which is more usually referred to as merely the correlation coefficient, is the correlation coefficient that is most frequently used for level scales that are either interval or ratio based.
What Exactly Is It That the Correlation Measures?
The study and measurement of the direction and extent of association among variables are referred to as correlation in statistics. Since correlation measures co-variation rather than causation, correlation does not prove that one variable causes another. Because of this, we should never use a correlation to mean that there is a cause-and-effect relationship.
For instance, if the value of one variable, X, is found to change in one direction, then the value of the other variable, Y, is discovered to vary in the same direction (i.e. positive change) or the opposite direction. This is an example of a correlation between two variables. When one variable’s value shifts in one direction, the value of the other variable shifts either in the same direction.
In addition, if there is a correlation between the two variables, the relationship is linear if it does exist. This means that the relative movement of the two variables may be represented on graph paper by drawing a straight line.
The Coefficient of Correlation
The extent of the statistical link between the two interval or ratio level variables can be summarized using a measure known as the correlation coefficient, abbreviated as r. A scale is applied to the correlation coefficient, ensuring that it will always be in the -1 to +1. When r is close to 0, it indicates that there is not much of a connection between the variables; nevertheless, the different r is from 0 on either the positive or negative side, the more of a connection there is between the variables.
The X and Y symbols are frequently used to represent the two variables. The values of X and Y are depicted by constructing the scatter diagram, which graphs the various combinations of the two variables to demonstrate how the 2 variables are related. The scatter diagram is presented first, followed by an explanation of how to calculate Pearson’s r.
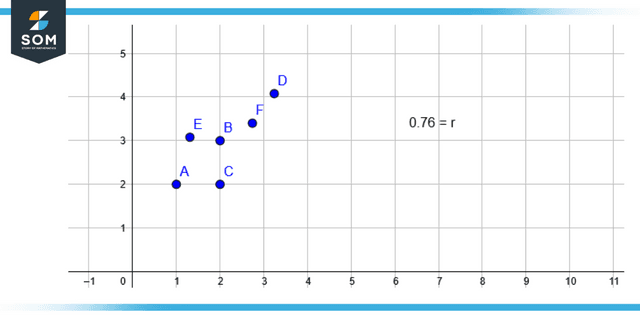
Figure 2: Representation of Coefficient of correlation
Scatter Diagram
A scatter diagram displays the values of two variables, such as X and Y, along with the pattern in which these two parameters are related to one another. On the graph, the values of variable X are presented along the horizontal axis, while the values of variable Y are presented along the vertical axis.
When the regression model is employed in the future, one of the variables will be specified as an independent variable. In contrast, the other variable will be defined as a dependent variable. When performing regression, it is assumed that the independent variable X has some effect or influence on the variable that is being analyzed, which in this case is Y.
The correlation methods are symmetric for the two variables, and the statistical evaluation does not indicate causality or the direction of impact. In the following illustration, a scatter diagram is presented. When it comes time to calculate the correlation coefficient, the same example will be used.
Types of Correlation
The scatter plot illustrates the relationship between the two variables or characteristics . It represents the degree to which the two variables are related. Three possible scenarios can be used to examine the connection between the two variables:
When the two variables are moving in the same direction, a rise or reduction in the value of one variable is accompanied by a rise or reduction in another variable; this is an example of a positive correlation.
A negative correlation exists when the values of the 2 variables move in the opposite direction, such that a decrease or increase follows an increase or decrease in the value of one variable in the value of the other variable. In other words, an increase in the value of one variable leads to a decrease or increase in the other variable.
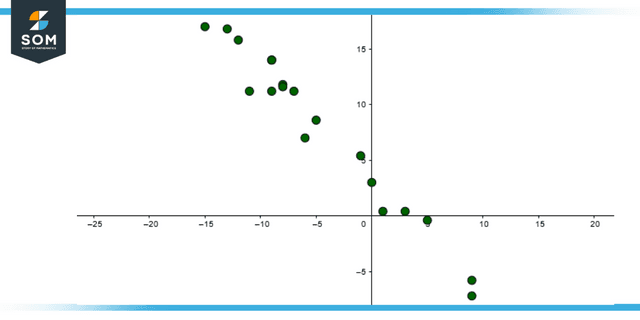
Figure 3: Representation of Negative Correlation
Example 1
Calculate the correlation coefficient of the given data.
| x | 2 | 4 | 6 |
| y | 3 | 5 | 7 |
Solution
| x | y | x2 | y2 | xy |
| 2 | 3 | 4 | 9 | 6 |
| 7 | 5 | 49 | 25 | 35 |
| 8 | 7 | 64 | 49 | 56 |
| Σx = 17 | Σy = 15 | Σx2 = 117 | Σy2 = 83 | Σxy = 97 |
We know that:
r = N Σxy – [(Σx) (Σy)] / [N Σx2 – (Σx)2]1/2 * [N Σy2 – (Σy)2]1/2
After putting the values, we get:
r = 36/ 38.5
r = 0.93
Example 2
Calculate the rank correlation of the given data:
Rank in Commerce (Rx) | Rank in Accountancy (Ry) | d = Rx – Ry | d2 |
| 1 | 2 | -1 | 1 |
| 4 | 2 | 2 | 4 |
| 3 | 5 | -2 | 4 |
| 7 | 6 | 1 | 1 |
| 9 | 7 | 2 | 4 |
Solution
ρ = 1 – [ (6 Σd2) / {N (N2 – 1)} ]
= 1 – [ 6(14) / {5(25 – 1)} ]
= 0.3
All images/graphs are created using GeoGebra.